
Unlock Peak Efficiency: Your Comprehensive Guide to Value Stream Mapping
Visualize, analyze, and revolutionize your workflows by mastering this cornerstone of Lean methodology.
Key Insights into Value Stream Mapping
- Visual Clarity for Process Improvement: Value Stream Mapping (VSM) is fundamentally a visual tool that diagrams every step in a material and information flow, enabling clear identification of waste and opportunities for enhancement.
- Strategic Current and Future State Analysis: The VSM process involves creating a "Current State Map" to understand existing operations and a "Future State Map" to design a more efficient, waste-free process, providing a clear roadmap for transformation.
- Versatile Applicability Across Industries: Though rooted in manufacturing, VSM's principles are universally applicable and highly effective in diverse sectors such as software development, healthcare, logistics, and service industries for optimizing complex processes.
What is Value Stream Mapping? Demystifying the Core Concept
Value Stream Mapping (VSM) is a lean management technique used to analyze, design, and manage the flow of materials and information required to bring a product or service from its inception to the end customer. It's a powerful visualization tool that helps organizations see and understand all the activities, both value-adding and non-value-adding, within a specific process or "value stream."
The "value stream" itself encompasses every action – including design, production, and delivery – that contributes to creating value from the customer's perspective. The primary objective of VSM is to identify and systematically eliminate "waste" (often referred to as "Muda" in Lean terminology). Waste, in this context, is any activity that consumes resources but does not add value to the final product or service as perceived by the customer. By meticulously diagramming the entire process, VSM provides a clear, shared understanding of how work currently gets done and where improvements can yield the most significant impact.
Visualizing the interconnected elements of a value stream.
Historical Roots and Evolution of Value Stream Mapping
The origins of Value Stream Mapping are deeply embedded in the principles of Lean manufacturing, most notably pioneered by Toyota Motor Corporation as an integral part of its renowned Toyota Production System (TPS) in the mid-20th century. Within Toyota, it was often referred to as "material and information flow mapping." While the precise historical genesis is debated, with some influences potentially predating Toyota or evolving organically within the lean community, Toyota’s systematic application and refinement solidified its importance.
Early forms of diagrams depicting material and information flow can be traced back to the early 1900s. However, VSM as a formalized methodology gained prominence with the global adoption of Lean principles. Initially focused on manufacturing, its efficacy in identifying inefficiencies and fostering continuous improvement has led to its widespread adoption across a multitude of sectors. Today, VSM is a recognized and fundamental tool within Lean Six Sigma methodologies, applied in logistics, supply chain management, healthcare, software development (especially in DevOps and Agile frameworks), product development, project management, and various administrative and service-oriented processes.
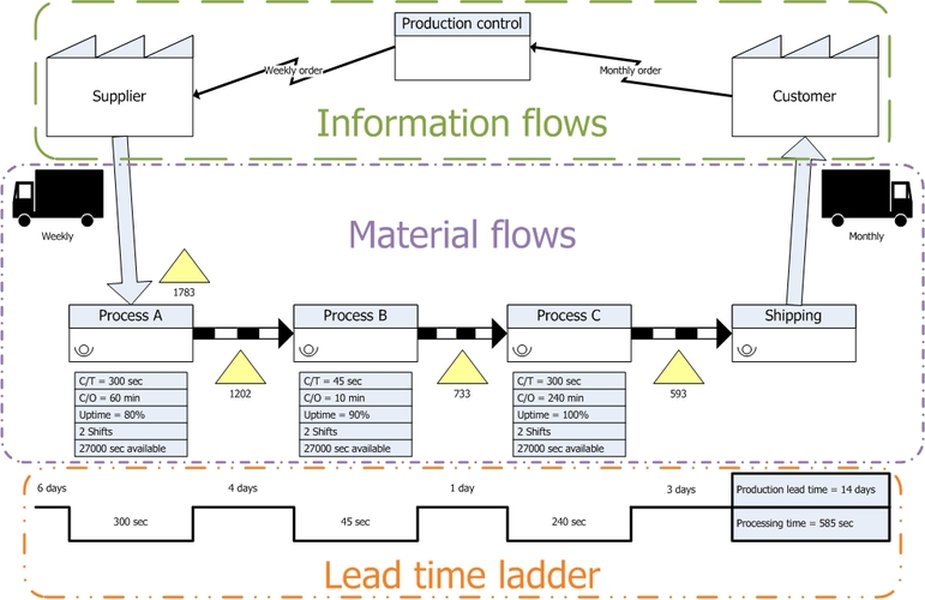
Key Components and Standardized Symbols in VSM
Value Stream Maps utilize a standardized set of symbols to visually represent the various elements of a process, ensuring clarity and universal understanding across teams and organizations. These symbols depict the flow of both materials and information, helping to clearly distinguish between value-adding activities and sources of waste.
Common VSM Symbols:
- Process Boxes: These represent the primary operational steps or tasks within the value stream (e.g., 'Assembly', 'QA Testing', 'Order Entry'). Data relevant to the process, like cycle time or number of operators, is often noted within or near these boxes.
- Inventory Triangles: A triangle symbol indicates locations where inventory (raw materials, work-in-progress, or finished goods) accumulates. High inventory levels often signify potential waste.
- Arrows:
- Push Arrows (Striped): Indicate that material is moved to the next step regardless of whether that step is ready, often leading to WIP buildup.
- Pull Arrows (Smooth/Curved): Represent a "pull" system where downstream processes signal to upstream processes when more material is needed (e.g., Kanban).
- Shipment Arrows (Truck/Plane Icons): Depict the movement of materials to external suppliers or from the facility to customers.
- Information Flow Arrows: Often shown as straight or jagged lines (lightning bolt for electronic info), these indicate how information (e.g., production schedules, customer orders, specifications) is communicated and triggers action within the value stream.
- Data Boxes: These are typically placed below process boxes or inventory symbols to capture critical metrics such as:
- Cycle Time (C/T): The time it takes to complete one unit of work within a specific process.
- Lead Time (L/T): The total time it takes for one unit to move through the entire value stream, or a segment of it, including wait times.
- Changeover Time (C/O): The time required to switch a machine or process from producing one type of product to another.
- Uptime: The percentage of time a machine or process is available and operating.
- Inventory Levels: Quantities of stock at various points.
- Supplier/Customer Icons: Represent the start and end points of the value stream being mapped, typically depicted as factory-like icons.
- Timeline: A critical component at the bottom of the map, showing lead times and processing times to calculate total lead time and value-added time.
The map is typically laid out to follow the product's journey from left to right. Value-adding steps are often highlighted, while non-value-adding steps (wait times, unnecessary transport) become visually apparent, facilitating their identification and elimination.
Common symbols used in Value Stream Mapping to depict processes, inventory, and flows.
The Value Stream Mapping Process: A Step-by-Step Guide
Implementing Value Stream Mapping is a systematic and collaborative effort. It typically involves the following key stages to move from understanding the current state to implementing an improved future state.
Step 1: Define the Scope and Assemble the Team
Selecting the Value Stream
Begin by identifying a specific product family or service process to map. Trying to map everything at once can be overwhelming. Focus on a high-impact area or a process causing significant issues.
Forming a Cross-Functional Team
Assemble a diverse team comprising individuals who are directly involved in the chosen value stream. This includes representatives from different departments or functions (e.g., sales, operations, logistics, quality). Their firsthand knowledge is invaluable for accurate mapping and buy-in for future changes.
Step 2: Create the Current State Map
Walking the Process (Gemba Walk)
The team should physically walk the path of material and information flow – an activity known as a "Gemba walk" (Gemba being the Japanese term for "the actual place"). This firsthand observation is crucial for capturing the reality of the process, not just how it's supposed to work.
Documenting and Gathering Data
As the team observes, they document each process step, material movements, information flows, and points of inventory accumulation using standard VSM symbols. Key data is collected for each step, including:
- Cycle time (time to complete one unit/task)
- Changeover time (time to switch between products/tasks)
- Uptime/Availability of equipment
- Number of operators
- Inventory levels (WIP, raw materials, finished goods)
- Lead time (total time through the process, including waits)
- Defect rates or rework loops
Step 3: Identify Waste and Inefficiencies
Analyzing the Current State Map
With the Current State Map complete, the team analyzes it to pinpoint sources of waste and bottlenecks. This involves looking for non-value-adding activities. Common types of waste (often remembered by acronyms like TIM WOODS or DOWNTIME) include:
- Transportation: Unnecessary movement of materials or information.
- Inventory: Excess stock tying up capital and space, hiding problems.
- Motion: Unnecessary movement of people or equipment.
- Waiting: Idle time for people, equipment, or information.
- Overproduction: Producing more, sooner, or faster than required by the next process or customer.
- Over-processing: Performing unnecessary work or adding features not valued by the customer.
- Defects: Products or services that require rework or are scrapped, leading to wasted resources.
- Non-Utilized Talent (Skills): Underutilizing employees' skills, creativity, and knowledge.
Calculating Total Lead Time vs. Value-Added Time
A key part of this analysis is calculating the total lead time and comparing it to the sum of the value-added processing times. Often, value-added time is a very small fraction of the total lead time, highlighting significant opportunities for improvement.
Step 4: Design the Future State Map
Brainstorming Improvements
Based on the waste identified, the team brainstorms improvements to create a leaner, more efficient process. This involves asking critical questions: How can we reduce waiting? How can we improve flow? Can steps be combined or eliminated? How can we implement pull systems?
Creating the Vision
The Future State Map visually represents this improved process. It depicts how material and information *should* flow, incorporating changes to eliminate bottlenecks, reduce inventory, shorten lead times, and improve overall quality and efficiency. This map serves as the vision for the transformation.
Step 5: Develop an Implementation Plan
Prioritizing Actions
Transitioning from the current to the future state requires a clear action plan. The team identifies specific projects or Kaizen (continuous improvement) events needed to achieve the Future State Map. These actions are prioritized based on impact and feasibility.
Assigning Responsibilities and Timelines
For each action item, responsibilities are assigned, and realistic timelines are established. Key performance indicators (KPIs) are defined to measure progress towards the future state goals.
Step 6: Execute, Monitor, and Continuously Improve
Implementing Changes
The team executes the implementation plan, making the necessary changes to processes, systems, and layouts.
Tracking Progress and Iterating
Progress is regularly monitored against the KPIs. Value Stream Mapping is not a one-time event but a cycle. Once the future state is achieved (or significant progress is made), it becomes the new current state, and the VSM process can be repeated to identify further opportunities for improvement, fostering a culture of continuous improvement (Kaizen).
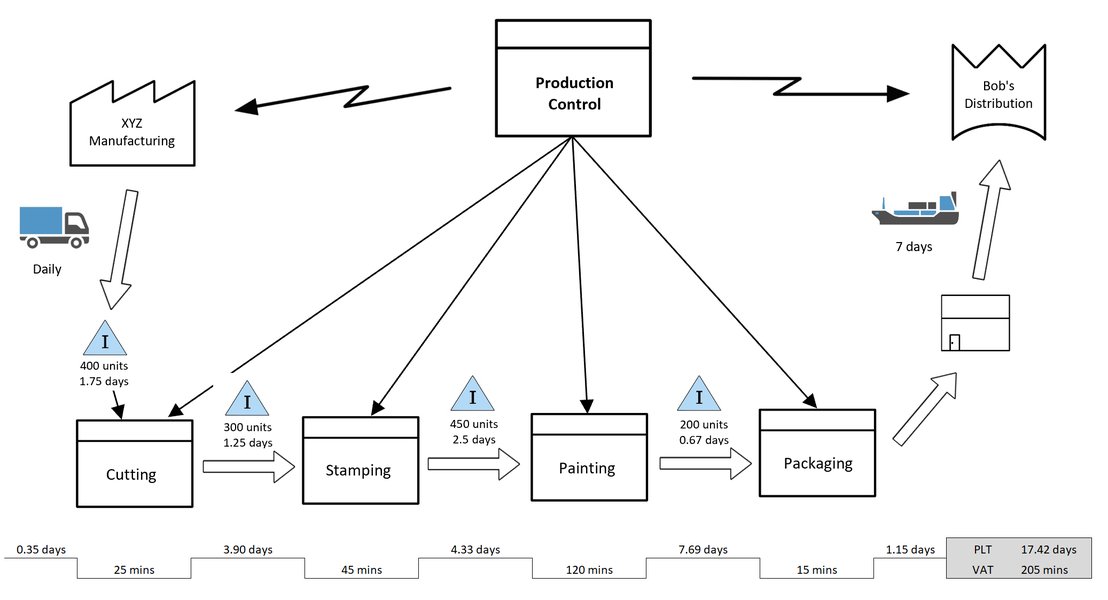
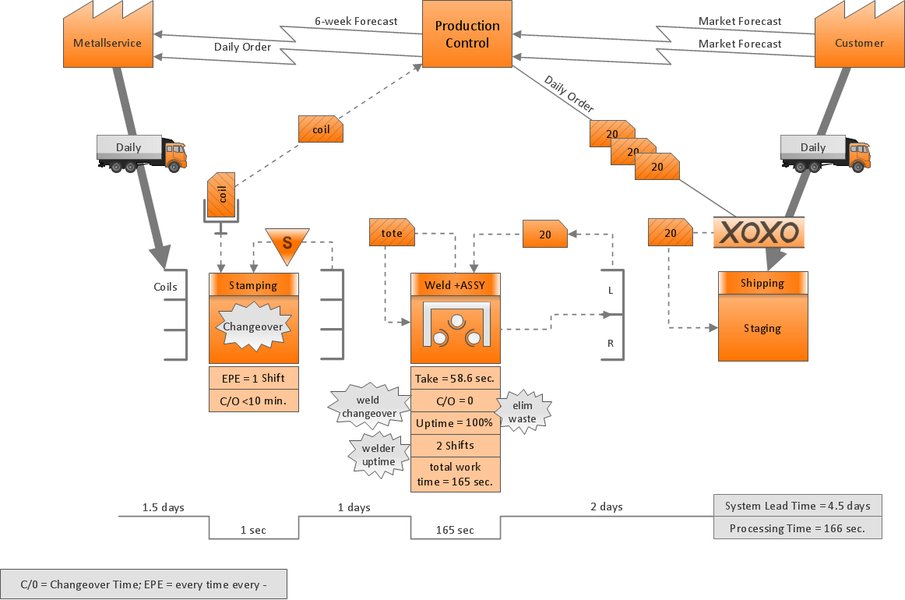
An illustrative example of a Value Stream Map in practice.
Unveiling the Multifaceted Benefits of VSM
Value Stream Mapping offers a wealth of benefits that extend beyond simple waste reduction, impacting various facets of an organization's performance. When effectively implemented, VSM acts as a catalyst for significant operational and cultural improvements.
The following chart provides a visual representation of the potential impact of VSM across several key performance areas. It contrasts a typical process state before VSM with the insights gained during current state analysis, the goals set by a future state design, and the realistic achievements post-implementation. This illustrates how VSM drives improvements in areas such as waste reduction, efficiency, process visibility, team collaboration, lead time reduction, and quality enhancement.
Key Benefits Detailed:
- Systematic Waste Reduction: VSM is exceptionally effective at identifying the seven (or eight) wastes (Muda) inherent in processes, enabling targeted elimination efforts.
- Improved Efficiency and Productivity: By streamlining workflows, removing bottlenecks, and reducing non-value-added activities, VSM leads to shorter cycle times and increased output with the same or fewer resources.
- Enhanced Process Visibility: The visual nature of VSM provides a clear and shared understanding of the entire process for all stakeholders, breaking down silos and fostering a holistic view.
- Better Lead Time Performance: Significant reductions in overall lead time (from order to delivery) are a common outcome, improving responsiveness to customer demand.
- Cost Savings: Reducing waste, inventory, rework, and optimizing resource utilization directly translates into lower operational costs.
- Improved Quality: By highlighting areas prone to defects or errors, VSM helps in implementing Poka-Yoke (error-proofing) and other quality improvement measures, reducing rework and scrap.
- Increased Employee Engagement and Collaboration: The VSM process is inherently collaborative, involving cross-functional teams. This participation fosters ownership, improves communication, and empowers employees to contribute to improvements.
- Foundation for Continuous Improvement (Kaizen): VSM provides a repeatable methodology and a baseline for ongoing improvement efforts, embedding a Kaizen culture within the organization.
- Strategic Alignment: It helps align operational activities with strategic business objectives by focusing efforts on processes that deliver the most value to the customer.
- Sustainability Gains: In some contexts, VSM can contribute to environmental sustainability by identifying and reducing waste in energy consumption, material usage, and transportation.
Diverse Applications of Value Stream Mapping Across Industries
While Value Stream Mapping has its roots in manufacturing, its principles and methodology are highly adaptable and have proven effective across a wide array of industries and organizational functions. The ability to visualize workflow, identify waste, and focus on customer value is universally beneficial.
The mindmap below illustrates the core concept of Value Stream Mapping and its branching applications into various sectors, highlighting its versatility. It also touches upon the key process steps and the primary benefits that drive its adoption.
Information Flow"] id1_2["Identify Value-Adding vs.
Non-Value-Adding Activities"] id1_3["Systematic Waste
Elimination (Muda)"] id2["Key Process Steps"] id2_1["Select Value Stream
& Form Team"] id2_2["Map Current State"] id2_3["Analyze & Identify Waste"] id2_4["Design Future State"] id2_5["Create Implementation Plan"] id2_6["Execute & Continuously
Improve (Kaizen)"] id3["Primary Benefits"] id3_1["Reduced Lead Times
& Cycle Times"] id3_2["Lower Operational Costs"] id3_3["Improved Product/Service
Quality"] id3_4["Enhanced Overall
Productivity"] id3_5["Better Team Collaboration
& Communication"] id3_6["Increased Customer
Satisfaction"] id4["Common Applications"] id4_1["Manufacturing Operations
(e.g., Assembly Lines, Fabrication)"] id4_2["Software Development & DevOps
(e.g., Feature Delivery, Deployment Pipelines)"] id4_3["Healthcare Processes
(e.g., Patient Journeys, Lab Services)"] id4_4["Supply Chain & Logistics
(e.g., Order Fulfillment, Warehousing)"] id4_5["Service Industries
(e.g., Banking, Insurance, Hospitality)"] id4_6["Administrative & Office Processes
(e.g., Hiring, Procurement, Reporting)"] id4_7["Product Development
(e.g., From Concept to Launch)"] id5["Foundational Principles"] id5_1["Lean Thinking Philosophy"] id5_2["Customer-Centric Value Definition"] id5_3["Continuous Improvement Culture"]
Specific Industry Examples:
- Manufacturing: This is the traditional domain of VSM, used to optimize production lines, reduce work-in-progress (WIP) inventory, shorten setup times, and improve overall equipment effectiveness (OEE).
- Software Development (Agile & DevOps): VSM helps visualize the entire development lifecycle, from idea conception and backlog grooming through coding, testing, deployment, and feedback. It's invaluable for identifying bottlenecks in cross-team communication, handoffs, and reducing cycle times for feature delivery.
- Healthcare: Used to map and improve patient journeys (e.g., emergency room visits, surgical procedures, outpatient clinics), administrative processes (e.g., billing, appointments), and laboratory workflows to reduce wait times, improve patient safety, and enhance care quality.
- Logistics and Supply Chain Management: VSM optimizes the flow of goods and information from suppliers through distribution centers to end customers, reducing lead times, transportation waste, and inventory holding costs.
- Service Industries: Banks use VSM for loan application processes, insurance companies for claims processing, and hospitality for guest services. It helps streamline customer-facing and back-office operations.
- Administrative and Office Processes: VSM can be applied to processes like hiring, procurement, financial reporting, and IT support to eliminate bureaucratic delays, reduce errors, and improve service delivery to internal customers.
- Product Development: Mapping the product development process from concept to market launch helps identify delays, improve cross-functional collaboration, and accelerate time-to-market.
- Project Management: Visualizing the flow of tasks and information in complex projects can help identify critical paths, dependencies, and areas for streamlining to improve project delivery times and resource utilization.
The adaptability of VSM lies in its focus on fundamental process dynamics – flow, waste, and value – which are relevant regardless of the specific industry or type of work being performed.
Summarizing Value Stream Mapping: Key Aspects at a Glance
To provide a concise overview, the following table summarizes the essential characteristics and elements of Value Stream Mapping, offering a quick reference to its core definition, objectives, components, procedural steps, primary advantages, common waste categories it addresses, and its wide-ranging applicability.
| Feature | Description |
|---|---|
| Definition | A Lean management method for analyzing the current state and designing an improved future state for the series of events (material and information flows) that take a product or service from its beginning through to the customer. |
| Primary Goal | To identify and systematically eliminate waste (Muda), thereby improving process flow, increasing efficiency, reducing lead times, and enhancing customer value. |
| Key Components | Current State Map, Future State Map, depiction of Material Flow, Information Flow, Process Data (cycle time, lead time, inventory, etc.), and a Timeline illustrating value-added vs. non-value-added time. |
| Core Steps in Implementation |
|
| Major Benefits | Significant reduction in lead times and cycle times, lower operational costs, improved product/service quality, increased productivity, enhanced team collaboration and communication, and greater customer satisfaction. |
| Common Wastes Identified (TIM WOODS/DOWNTIME) | Transportation, Inventory, Motion, Waiting, Overproduction, Over-processing, Defects, and Non-Utilized Talent/Skills. |
| Broad Areas of Application | Manufacturing, Software Development & DevOps, Healthcare, Logistics & Supply Chain, Service Industries (finance, insurance), Administrative Processes, Product Development, Project Management. |
Deeper Dive: Value Stream Mapping in Action
To further understand the practical application of Value Stream Mapping, the following video provides a step-by-step guide on how to conduct a VSM exercise. It covers the fundamental aspects, from identifying a value stream to creating current and future state maps, offering valuable insights for those looking to implement this powerful tool.
This video, "How to Value Stream Map [STEP BY STEP]," elaborates on the core mechanics of VSM. It explains what VSM is, why it's beneficial, how to go about creating the maps, and when it's most appropriate to use. Such practical guidance can help bridge the gap between theoretical understanding and real-world application, demonstrating how teams can collaboratively visualize their processes, identify inefficiencies, and strategize improvements for enhanced performance and customer value.
Why Value Stream Mapping Matters in Modern Business
In today's dynamic and fiercely competitive global market, organizations continually seek ways to enhance efficiency, responsiveness, and customer satisfaction while managing costs. Value Stream Mapping remains profoundly relevant because it provides a proven, structured approach to achieving these critical business objectives. Its emphasis on customer value ensures that improvement efforts are focused on what truly matters. By making waste and inefficiencies visible, VSM empowers teams to make data-driven decisions and implement targeted changes that yield tangible results. Furthermore, its collaborative nature fosters a culture of continuous improvement (Kaizen), which is essential for long-term adaptability and success in an ever-evolving business landscape.
Frequently Asked Questions (FAQ)
Recommended Further Exploration
- How can Value Stream Mapping be specifically adapted for agile software development environments?
- What are the most common challenges encountered when implementing Value Stream Mapping and how can they be overcome?
- Explore advanced Value Stream Mapping techniques for complex global supply chains.
- How does Value Stream Management (VSMgt) as a broader concept build upon Value Stream Mapping?
References
Last updated May 9, 2025