
Unveiling the Protein Power in Your Veggies: A Raw vs. Cooked Comparison
Discover how preparation methods can influence the protein content of your favorite vegetables.
Vegetables are renowned for their vitamins, minerals, and fiber, but they also contribute to our daily protein intake. Understanding how protein content varies between raw and cooked states, and which vegetables pack the most punch, can help optimize your nutritional goals. This guide delves into the protein percentages by weight for a variety of common vegetables, offering insights into how cooking transforms them.
Key Protein Insights
- Cooking's Impact: Cooking vegetables often leads to water loss, which can concentrate nutrients like protein, making the percentage by weight appear higher in cooked versions compared to raw for the same 100g portion.
- Vegetable Variability: Protein content can vary significantly among different types of vegetables, with legumes (like peas and beans) generally offering higher amounts than leafy greens or root vegetables.
- Beyond Percentages: While percentage by weight is a useful measure, the overall dietary pattern and variety of vegetables consumed are crucial for meeting protein needs and obtaining a wide array of essential amino acids.
Understanding Protein in Vegetables
Protein content in food is typically measured in grams of protein per 100 grams of the food item. This value directly translates to the protein percentage by weight (e.g., 5 grams of protein per 100 grams of vegetable means it's 5% protein by weight). While vegetables might not rival meat or dairy in sheer protein density, they are vital contributors, especially in plant-based diets.
The Effect of Cooking on Protein Content
When vegetables are cooked, several changes occur:
- Water Loss: Many cooking methods, like roasting or stir-frying, cause vegetables to lose water. This reduction in total weight means the remaining nutrients, including protein, become more concentrated. Thus, 100 grams of a cooked vegetable might contain more protein than 100 grams of its raw counterpart.
- Nutrient Leaching: Boiling can cause some water-soluble nutrients to leach into the cooking water. While protein is generally more stable, prolonged boiling in excessive water might lead to slight losses. Steaming is often considered a better method for nutrient retention.
- Bioavailability: Cooking can sometimes break down cell walls, making certain nutrients, including protein, more digestible and bioavailable.
It's important to remember that while the percentage of protein by weight might increase upon cooking due to water loss, the absolute amount of protein in the original raw portion doesn't magically increase; it just becomes more concentrated in a smaller, denser mass.
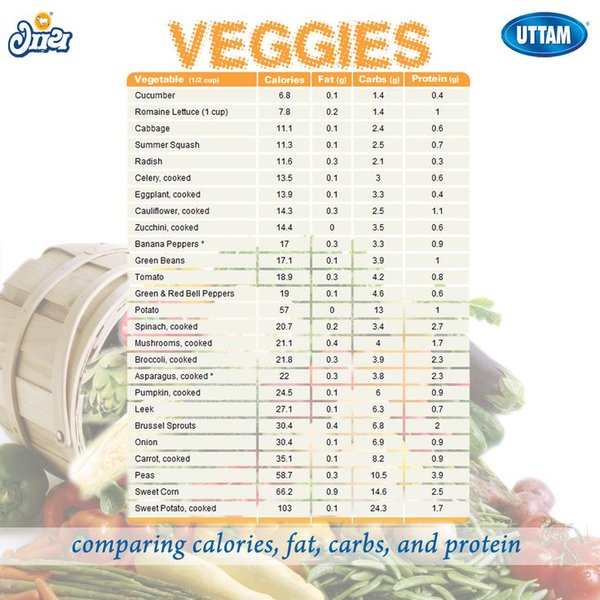
A visual comparison of nutritional components in various vegetables.
Comparative Protein Table: Raw vs. Cooked Vegetables
The following table presents the approximate protein content as a percentage by weight (grams of protein per 100 grams of vegetable) for various vegetables in both their raw and cooked states. Values are synthesized from multiple nutritional databases and can vary based on specific varieties, growing conditions, and precise cooking methods. "Cooked" generally refers to common methods like boiling or steaming.
| Vegetable | Protein % by Weight (Raw) | Protein % by Weight (Cooked) | Notes on Changes and Data |
|---|---|---|---|
| Soybean Sprouts (stir-fried) | Data typically for cooked | ~13.1% | High in protein; cooking method specified as stir-fried. |
| Lentils | ~9.0% (dry weight) | ~9.0% | Absorb water when cooked, but protein percentage based on cooked weight remains high. Considered a legume. |
| Chickpeas | Data typically for dry/cooked | ~8.2 - 8.9% | Significant protein source, data for cooked. Considered a legume. |
| Green Peas | ~5.4% | ~5.4% - 7.2% | Cooking can concentrate protein due to water loss. Some sources show stable, others an increase. |
| Lima Beans | Data typically for cooked | ~6.8% | Good protein source among beans. |
| Spinach | ~2.9% | ~3.0% - 3.1% | Appears higher when cooked due to significant water loss and concentration of nutrients. |
| Kale | ~3.3% - 4.3% | ~3.5% | Slight variations depending on source; cooking may slightly alter concentration. |
| Brussels Sprouts | ~3.4% | ~3.4% - 3.6% | Protein content is fairly stable; slight increase possible from water loss. |
| Artichokes | ~3.3% | ~3.3% | Consistent protein content raw vs. boiled. |
| Sweet Corn | ~3.2% - 3.3% | ~3.5% - 3.6% | Slight increase in protein concentration when cooked due to water loss. |
| Mushrooms (common varieties) | ~3.1% | ~3.5% - 3.7% | Cooking reduces water content, concentrating protein. |
| Broccoli | ~2.8% | ~2.8% - 3.0% | Protein relatively stable; slight concentration can occur. Steaming is often preferred over boiling. |
| Asparagus | ~2.2% | ~2.8% - 2.9% | Noticeable increase in protein concentration after cooking due to water loss. |
| Cauliflower | ~1.9% | ~1.9% - 2.1% | Minimal change in protein content. |
| Potatoes (with skin) | ~2.0% | ~2.0% - 2.5% (baked/boiled) | Slight increase possible depending on cooking method and water loss. |
| Sweet Potato | ~1.6% | ~1.3% - 2.0% (baked/boiled) | Protein content can vary; some sources show slightly lower cooked percentage, others slightly higher. |
| Carrots | ~0.9% | ~0.9% | Protein content remains very stable. |
Note: Legumes like lentils, chickpeas, and various beans are technically not vegetables in a strict botanical sense for some classifications but are often consumed as part of a vegetable-rich diet and are excellent sources of plant protein. They are included for comprehensive comparison.
Nutritional Profile Radar: A Snapshot of Key Vegetables
This radar chart provides a visual comparison of selected vegetables across several nutritional dimensions, including their raw and cooked protein content, fiber, and a key vitamin. The values are scaled from 1 (lowest relative contribution) to 10 (highest relative contribution among these selected items) for illustrative purposes and are based on general nutritional data. This helps visualize how different vegetables offer unique nutritional strengths and how cooking might influence some of these aspects, particularly protein concentration.
This chart highlights that lentils are a protein standout when cooked. Spinach shows a slight protein concentration increase and is strong in iron. Broccoli is notable for Vitamin C and maintains its protein level well. Green peas also offer a good balance. Remember, these are relative comparisons among the chosen items and attributes.
Factors Influencing Vegetable Protein Content
The protein you get from vegetables isn't just about raw versus cooked; many elements play a role. This mindmap illustrates the interconnected factors that determine the final protein content and nutritional value of vegetables on your plate.
Higher Protein"] id1a2["Leafy Greens (Spinach, Kale)
Moderate Protein"] id1a3["Root Vegetables (Carrots, Potatoes)
Lower Protein"] id1a4["Fruiting Vegetables (Tomatoes, Peppers)
Lower Protein"] id1b["Variety within Species"] id1c["Maturity at Harvest"] id1d["Growing Conditions"] id1d1["Soil Quality & Nutrients"] id1d2["Climate & Sunlight"] id1d3["Farming Practices"] id2["Post-Harvest & Preparation Factors"] id2a["Storage Conditions & Duration"] id2b["Processing (e.g., sprouting)"] id2c["Preparation State"] id2c1["Raw"] id2c1a["Enzyme Preservation"] id2c1b["Higher Water Content (lower % protein by weight)"] id2c2["Cooked"] id2c2a["Cooking Method"] id2c2a1["Boiling (potential leaching)"] id2c2a2["Steaming (good retention)"] id2c2a3["Roasting/Baking (concentration via water loss)"] id2c2a4["Stir-frying (quick cook, variable water loss)"] id2c2b["Water Loss/Gain (affects % by weight)"] id2c2c["Improved Digestibility (for some)"] id2c2d["Enhanced Bioavailability (for some nutrients)"] id2c2e["Potential Nutrient Degradation (heat-sensitive vitamins)"] id3["Dietary Context"] id3a["Combination with other Foods
(e.g., grains for complete protein)"] id3b["Overall Dietary Intake"]
As the mindmap shows, from the type of vegetable and its growing journey to how it's stored and prepared, numerous variables influence its final protein contribution to your diet. Understanding these can help in making informed choices for maximizing nutritional benefits.
Visualizing Vegetable Nutrition
Comparing nutritional data can be complex. Videos that rank or explain vegetable nutrients can offer a more dynamic understanding. The following video provides a tier list of vegetables based on their overall nutritional profiles, which can offer context to their protein content among other benefits.
This video ranks vegetables based on their nutritional value, offering insights into which ones provide the most benefits, including protein.
Such analyses often consider a range of factors, including vitamin and mineral content, antioxidant levels, and fiber, in addition to macronutrients like protein. This holistic view helps in appreciating the diverse contributions of different vegetables to a healthy diet.
Frequently Asked Questions (FAQ)
How does cooking generally affect the protein percentage in vegetables?
Cooking, especially methods that lead to water loss (like roasting or stir-frying), can increase the protein percentage by weight. This is because the total weight of the vegetable decreases, concentrating the existing protein into a smaller mass. For example, 100g of cooked spinach often has a higher protein percentage than 100g of raw spinach due to significant water reduction. However, the absolute amount of protein in the original serving doesn't increase; it just becomes more concentrated. Some cooking methods, like prolonged boiling in large amounts of water, might lead to minor losses of water-soluble nutrients, but protein is generally quite stable during typical cooking processes.
Are vegetables a complete source of protein?
Most individual vegetables are not considered "complete" proteins, meaning they may not contain all nine essential amino acids in the ideal proportions that the human body requires. However, some plant foods, like soybeans (including edamame and tofu) and quinoa, are complete proteins. For a diet relying on plant-based protein, it's important to consume a variety of vegetables, legumes, grains, nuts, and seeds throughout the day. This variety ensures that you receive an adequate supply of all essential amino acids.
Which vegetables (and related plant foods) are highest in protein?
Legumes are powerhouses of plant-based protein. Cooked soybeans (especially sprouted), lentils, chickpeas, black beans, and kidney beans are among the highest. Among common vegetables, green peas, spinach, kale, Brussels sprouts, asparagus, and broccoli offer good amounts of protein. Mushrooms also provide a decent quantity.
Is raw or cooked better for protein intake from vegetables?
For protein specifically, the difference often comes down to concentration and bioavailability. Cooked vegetables may show a higher protein percentage by weight due to water loss, and cooking can sometimes make protein more digestible. However, raw vegetables retain certain enzymes and heat-sensitive vitamins that can be lost during cooking. For overall nutrition, a balanced approach incorporating both raw and properly cooked vegetables is generally recommended. Light steaming or quick stir-frying are often preferred cooking methods to maximize nutrient retention while enhancing digestibility.
Recommended Further Exploration
- How do different cooking methods affect nutrient retention in vegetables beyond just protein?
- What are the best vegetable combinations to achieve complete protein intake on a vegan diet?
- Can you provide a list of high-protein meal ideas centered around vegetables and legumes?
- What is the role of vegetable protein in muscle building and overall health?
References
Last updated May 8, 2025