
The Impact of Visual Analytics on Customer Engagement
Discover how visual data insights boost customer satisfaction and loyalty
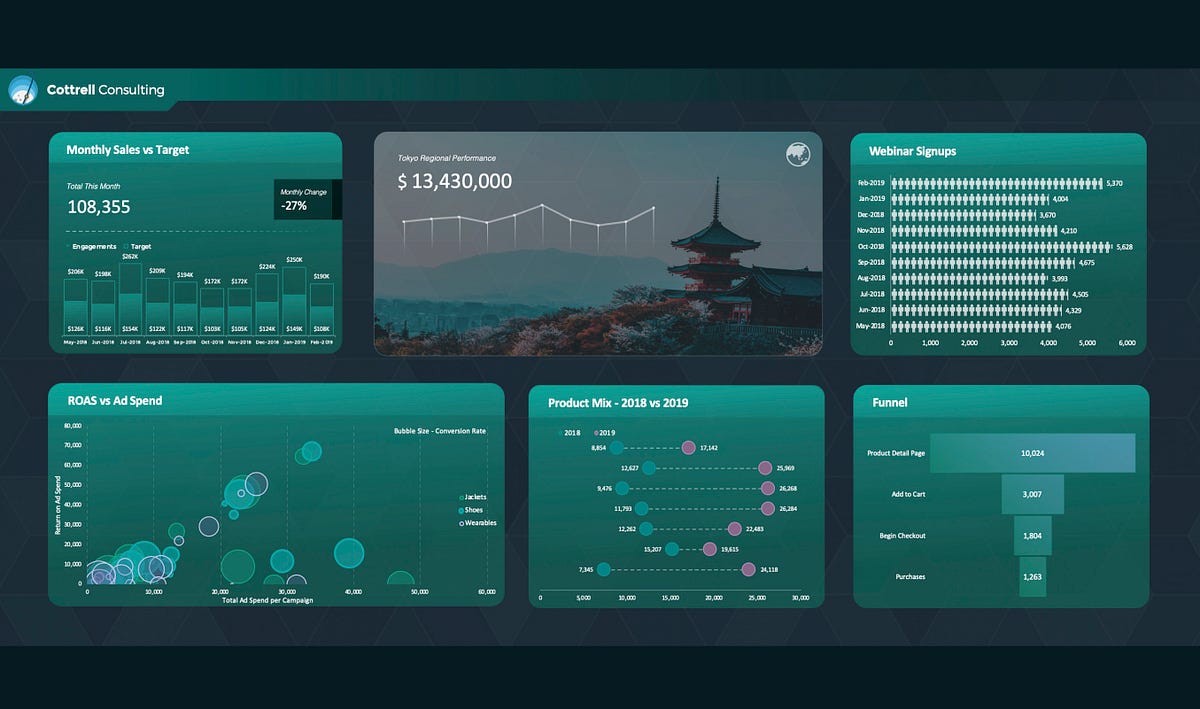
Key Highlights
- Enhanced Understanding: Visual analytics transforms complex datasets into intuitive, accessible insights that clarify customer behavior.
- Personalization and Engagement: Tailored visualizations drive targeted marketing, deepening customer interaction.
- Data-Driven Decision Making: Real-time data and dynamic dashboards empower businesses to adapt and optimize strategies effectively.
Understanding Visual Analytics
Visual analytics is the process of transforming raw data into appealing graphical representations that allow stakeholders to readily identify trends, patterns, and outliers. By leveraging visual tools such as charts, graphs, interactive dashboards, and even augmented reality applications, businesses can quickly dissect large volumes of customer information. This approach not only enhances internal analysis but also fosters transparency by enabling teams to see and interpret data more naturally.
In the digital age, where businesses are inundated with data from various online channels—social media interactions, website visits, e-commerce transactions, and customer feedback—visual analytics serves as a critical bridge to understanding. It distills vast amounts of information into concise visuals, offering immediate insights into engaging customer trends and aiding in the optimization of marketing campaigns. This becomes especially significant when high-quality data visualization unlocks patterns in consumer behavior that might otherwise remain unnoticed.
Enhancing Customer Engagement through Visual Analytics
Enhanced Data Comprehension and Interpretation
One of the primary advantages of visual analytics is its ability to convert complex datasets into coherent and straightforward formats. By utilizing visual elements such as interactive graphs, heat maps, and pie charts, companies gain a clearer understanding of their target audiences. This clarity facilitates the discovery of trends in customer interactions—such as peak engagement times, popular product features, and recurring customer preferences—that might have been buried in raw numbers.
Interactive Exploration
Unlike static data presentation, interactive visual dashboards enable business users to explore data dynamically. Decision-makers can drill down into specific segments, adjusting parameters on the fly, to identify the reasons behind customer behaviors. For example, a drop in engagement might be rectified by analyzing regional data breakdowns or specific time slots, enabling rapid strategy adjustments.
Personalization and its Role in Customer Retention
Visual analytics is instrumental in creating personalized customer experiences. By segmenting data based on demographics, behavioral patterns, and purchasing histories, businesses can curate highly targeted marketing campaigns. This specificity not only caters to individual tastes but also builds stronger, more personal connections with customers.
Customer Journey Mapping
Visualization tools can map out the entire customer journey, highlighting touchpoints where engagement peaks and where friction occurs. When businesses present these maps, they gain a detailed overview of the customer experience, which is invaluable during strategy development. Effective mapping allows organizations to refine customer service tactics, optimize website interfaces, and tailor communications based on real-time feedback.
Enhanced personalization combines robust analytics with effective data storytelling. Data storytelling weaves a compelling narrative around key insights, bringing emotional context into what would otherwise be dry statistics. Through visuals, brands establish trust and a sense of transparency, encouraging customers to feel valued and understood.
Real-Time Insights for Informed Decision Making
One of the standout features of modern visual analytics platforms is their capacity to deliver real-time data. In today’s fast-paced business environment, having the ability to quickly visualize and interpret customer engagement metrics allows companies to respond promptly to emerging trends or issues. Real-time insights ensure that marketing strategies are constantly refined and aligned with current consumer sentiments.
Dynamic Dashboards and Performance Metrics
Dashboards that update live with key performance indicators (KPIs) such as click-through rates, customer satisfaction scores, conversion rates, and time spent on the site provide decision-makers with a constant, accurate portrait of customer engagement. These metrics are crucial for identifying both peaks and troughs in performance, helping businesses fine-tune their actions and allocate resources effectively.
When incorporated into customer engagement strategies, real-time analytics allow for flexible marketing campaigns that can be adjusted instantaneously. For instance, if a particular visual campaign demonstrates higher than anticipated user engagement, the strategy might be expanded to leverage that success. Conversely, if a situation arises where engagement metrics drop, immediate adjustments prevent prolonged negative impacts.
Impact on Marketing Strategies and Campaign Effectiveness
Optimizing Campaign Performance
Beyond simply interpreting data, visual analytics plays a pivotal role in refining overall marketing strategies. By monitoring the performance of visual elements across multiple campaigns, businesses can assess which techniques yield the most customer engagement. This might include comparing different types of content—such as videos, infographics, and interactive product demos—to determine what resonates best with their audiences.
Content Strategy Insights
Visual analytics provides a granular understanding of customer preference for digital content. Analyzing engagement data collected from social media platforms, websites, and email campaigns presents a clearer picture of the effectiveness of visual elements in marketing. For instance, if data indicates that customers are likely to interact with vibrant infographics more than static images, businesses can adapt their content strategies accordingly. This targeted approach not only increases engagement but also enhances overall brand recognition and loyalty.
Integration of Advanced Visualization Technologies
The emerging use of technologies such as augmented reality (AR) in visual analytics marks a significant evolution in customer engagement. AR allows customers to interact in a three-dimensional space, thereby providing a more immersive experience. This integration helps customers explore products virtually, experience interactive demonstrations, and even visualize the use of a product in real-life environments.
Augmented Reality Applications
AR not only enhances customer engagement but also bridges the gap between digital and physical experiences. When businesses implement AR features within their digital platforms, customers gain a deeper understanding of product details in a visually stimulating manner. In sectors such as retail or real estate, for example, AR dashboards and visual analytics tools serve as both informational and entertainment mediums, raising customer satisfaction.
Measuring the Effectiveness of Visual Analytics
Key Performance Indicators (KPIs) in Visual Analytics
To fully understand the impact of visual analytics on customer engagement, it is essential to focus on measuring key performance indicators (KPIs). Common KPIs include customer interaction rates, conversion metrics, customer satisfaction ratings, and overall engagement levels across marketing channels. These metrics are raised to the forefront through dynamic, easy-to-read visual tools.
The ability to track these KPIs in real time represents a major advantage. CEOs, marketers, and operational teams can all benefit from visible dashboards that illustrate performance in areas such as social media engagement, click-through rates, and conversion ratios. These metrics not only provide guidance for strategic adjustments but also validate the effectiveness of the visual tools employed.
A Visual Comparison of Key Metrics
| Metric | Description | Impact on Engagement |
|---|---|---|
| Click-Through Rate (CTR) | Ratio of users who click on a link to the total users | Indicates the effectiveness of visual call-to-actions and content attractiveness |
| Conversion Rate | Percentage of users who complete a desired action | Measures the success of personalized campaigns driven by visual insights |
| Time on Page | Average duration a user spends on a webpage | Reflects content engagement and the quality of data storytelling |
| Social Media Engagement | Likes, shares, comments, and overall interactions on social platforms | Shows how effectively visual content captures audience attention and stimulates discussion |
| Customer Satisfaction Score (CSAT) | Direct feedback from customers regarding satisfaction levels | Higher satisfaction correlates with improved customer loyalty and repeat business |
Monitoring these KPIs through visual dashboards equips organizations with the ability to promptly adjust strategies and explore what works best in enhancing customer engagement.
Case Studies: Visual Analytics in Action
Businesses across numerous industries have successfully implemented visual analytics, resulting in tangible improvements in customer interaction and retention. For example, e-commerce platforms now use visual analytics to track shopping behavior—displaying purchase trends, evaluating product popularity, and determining the impact of promotional campaigns. These platforms benefit from rapid data interpretation, which allows them to dynamically adjust inventory, improve customer service, and refine marketing messages to better suit consumer preferences.
In another instance, financial services utilize line charts and trend maps that provide clients with understandable depictions of financial data. This method not only demystifies complex information but also allows customers to make informed decisions based on a clear overview of market trends. The result is a more engaged customer base that feels confident in its interactions with the institution.
Enhancing Engagement with Advanced Techniques
Data Storytelling and Emotional Connection
One of the profound benefits of visual analytics is its ability to enable data storytelling. By carefully designing visuals that outline a narrative, businesses can bridge the gap between hard data and human emotion. Effective storytelling creates relatability and helps customers understand how a product or service benefits them. In doing so, it instills a sense of trust and transparency.
Narrative Visualization
Narrative visualization combines the power of storytelling with statistical rigor. This method involves constructing visual stories that not only present data but also provide context, background information, and future predictions. The combination of qualitative and quantitative data enables a comprehensive narrative that is both informative and engaging. Customers, seeing their concerns and aspirations visually represented, feel more connected to the brand.
Integration with Modern Technologies
In the evolving technological landscape, visual analytics is increasingly integrated with other advanced technologies. Besides augmented reality, artificial intelligence (AI) and machine learning (ML) algorithms are being harnessed to analyze customer data more deeply and project future trends. These integrations facilitate more accurate predictions about customer behavior patterns, allowing businesses to be proactive rather than reactive.
For example, using AI-enhanced predictive analytics alongside traditional visualization methods, businesses can spot early indicators of shifting customer sentiments. This combination provides an invaluable competitive edge, equipping organizations to deploy targeted strategies that preempt market changes. The result is an agile, customer-centric approach that continuously adapts to evolving expectations.
Driving Business Outcomes with Visual Analytics
Customer Loyalty and Revenue Growth
The direct consequences of employing visual analytics extend well beyond just improved customer engagement. Businesses report enhanced customer retention rates and significant revenue growth as a result of targeted, visually-driven marketing strategies. With better insights into customer preferences and rapid adjustments based on real-time analytics, companies create long-lasting relationships that foster loyalty and encourage word-of-mouth promotion.
Actionable Insights
By clearly visualizing the customer journey and highlighting areas for improvement, organizations are able to take decisive, informed actions. Whether it is launching a new feature on a platform, rethinking the layout of an online store, or revisiting the content strategy on social media, these graphical insights facilitate meaningful change and drive overall business performance.
Moreover, interactive dashboards and performance visualizations are being used to streamline internal processes. Teams across departments—from marketing to product development—can access consistent, up-to-date data that supports collaborative decision-making and encourages a culture of transparency.
The Future of Visual Analytics
As visual analytics continues to evolve, we expect to see further integration with emerging technologies such as AI, machine learning, and augmented reality. This evolution will undoubtedly lead to even more immersive customer experiences and a sharper focus on personalization. Companies investing in these technologies stand to reap significant benefits, including deeper customer insights, increased engagement, and more targeted revenue growth initiatives.
The power of visual analytics lies in its capacity not only to present data but also to convert it into actionable insights that directly influence business strategy. As more organizations adopt these techniques and invest in the necessary technology infrastructure, the scope for improved customer engagement and satisfaction will grow, ushering in a new era of data-driven marketing excellence.
References
- Visual Analytics: Exploring and Understanding Data Better - ThoughtSpot
- Customer Engagement Analytics - UserPilot
- Engage Customer with Data Visualization - Toucantoco
- Customer Engagement Analytics - Sprinklr
- How Visual Content Analytics Boosts Customer Loyalty - LinkedIn
Recommended Explorations
Last updated March 5, 2025