
Visual Free Energy Landscape Analysis
Exploring the dynamics and thermodynamics of molecular systems visually
Key Highlights
- Collective Variables and Dimensionality Reduction: Essential for mapping out meaningful energy surfaces.
- 2D and 3D Visualization Tools: Enable comprehensive insight into conformational states and transition pathways.
- Applications and Practical Challenges: Provides deep insights into biomolecular dynamics while facing high-dimensional complexity.
Introduction
Visual free energy landscape (FEL) analysis is a state-of-the-art computational technique used to unravel the complexities of molecular dynamics by mapping the potential energy surfaces of molecular systems. This method enables researchers to study the thermodynamic and kinetic properties of molecules, particularly in phenomena such as protein folding, molecular recognition, and biomolecular interactions. By employing various visualization techniques, scientists can identify stable states, energy barriers, and the transition pathways that connect different conformational states. This, in turn, provides deep insights into the underlying mechanisms that govern molecular behavior.
Understanding Free Energy Landscapes
Conceptual Overview
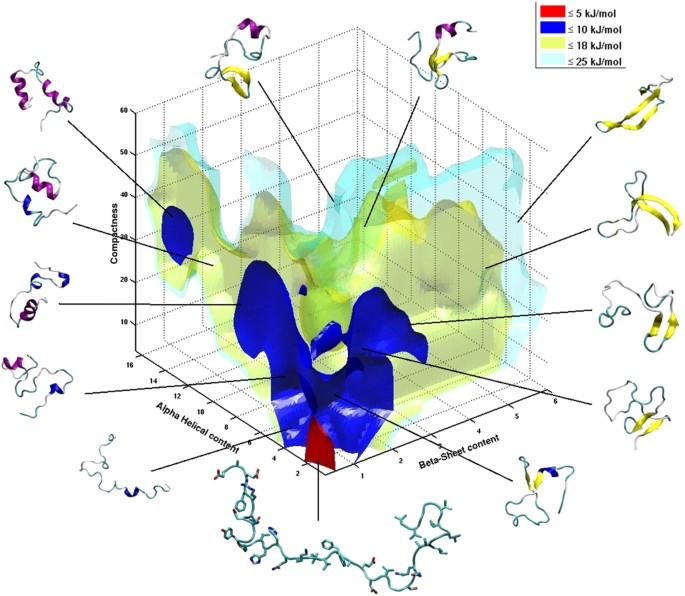
The free energy landscape of a molecular system is a multidimensional representation where each point corresponds to a specific conformation of the system characterized by an energy value. The landscape is typically visualized by plotting the free energy as a function of one or more collective variables (CVs), which are measures that capture essential motions or changes in the system. These variables may include distances, angles, or more complex descriptors that summarize the system’s structure.
Collective Variables (CVs)
Collective variables are pivotal in the analysis because they simplify the high-dimensional simulation data into more manageable forms. For instance, principal component analysis (PCA) is often utilized to select those components that explain the largest variance in the motion, effectively reducing the complexity and noise from the data. This reduction allows for a clearer interpretation of important energy minima that represent stable conformations and the energy barriers that indicate the transition states.
Dimensionality Reduction Techniques
Techniques like PCA and other nonlinear dimensionality reduction methods help in distilling complex molecular trajectories into two or three principal components. The analysis then focuses on these dimensions to provide a comprehensible visualization of the FEL. This approach not only highlights the stable states but also aids in discerning the pathways of conformational changes.
Visualization Methods
2D versus 3D Visualizations
Visualization plays a critical role in interpreting free energy landscapes. Two-dimensional (2D) and three-dimensional (3D) plots serve as powerful tools to represent the intricate interplay of variables that govern molecular behavior.
2D Visualizations
2D FELs are typically generated by plotting the free energy against one or two chosen collective variables. These plots reveal essential features such as energy minima, where the system is most stable, and energy barriers, which denote the hurdles that must be overcome for the system to transition from one state to another. Histogram analyses of the CV distributions further augment these plots by providing statistical insights into the frequency and occurrence of various conformational states.
3D Visualizations
Three-dimensional visualizations add another layer of depth by incorporating an additional collective variable or directly mapping free energy values as the third axis. This comprehensive view aids researchers in exploring the energy landscape from multiple angles, exposing subtleties that might be missed in 2D representations. Tools offering interactive 3D visualizations allow for rotation, zooming, and panning, empowering users to inspect the FEL closely and observe transient states and dynamic transitions.
Tools and Software for FEL Analysis
Popular Tools
A range of dedicated software tools have been developed to aid in the visualization and analysis of free energy landscapes derived from molecular dynamics simulations. These tools often offer both 2D and 3D visualization capabilities as well as advanced functionalities such as real-time rendering, histogram analysis, and path of least action calculations.
| Tool Name | Features | Visualization Type | Reference |
|---|---|---|---|
| Free Energy Landscape Analysis Tool | Histogram analysis, 2D/3D plots, animated GIFs, CV vs. frame insights | 2D and 3D | GitHub Repository |
| MD DaVis | Interactive 3D plots; rotation and zooming capabilities | 3D | Documentation |
| Free_Energy_Landscape-MD Python Package | 3D FEL creation, PCA-based analysis, time frame extraction for minima | 3D | Bioinformatics Review |
Additional tools, such as POLARIS, automate the identification of the path of least action, which is the most probable sequence of transitions between energy minima. These tools augment our understanding of dynamic processes, such as protein folding, by enabling clear visualization of conformational transitions.
Practical Applications of FEL Analysis
Protein Folding and Biomolecular Interactions
The application of free energy landscape analysis in the study of protein folding provides crucial insights into the folding pathways, intermediate conformations, and transition states that proteins undergo as they achieve their functional three-dimensional structures. The energy minima on the FEL correspond to various conformational states, some of which may be transient intermediates or stable folded forms. By dissecting these landscapes, researchers can understand both the thermodynamics (the stability of a given state) and kinetics (the speed and probability of transitions) of protein folding.
Moreover, drug design and molecular recognition studies benefit significantly from FEL analysis. Stable conformations often serve as targets for drug binding. Identifying these states enables the rational design of molecules that can bind preferentially to active or inactive forms, modulating the function of the protein of interest.
Dynamic Pathway Identification
One of the advanced applications of FEL analysis is the identification of transition pathways that a system undertakes when moving between states. With the aid of the FEL, researchers can trace the most probable path of molecular transitions, thereby comprehending the detailed dynamic processes within a system. This is particularly useful in simulations where tracking every minuscule shift manually is impractical. The path of least action—being the route with the lowest energetic cost—can be identified and further analyzed to understand the underlying kinetics.
Challenges and Ongoing Research
Complexity of High-Dimensional Systems
Despite the advancements in computational methods, one of the primary challenges in free energy landscape analysis is handling the high-dimensionality inherent in molecular simulations. Selecting appropriate collective variables is a crucial step that largely impacts the quality and interpretability of the resulting energy landscape. The complexity increases when multiple degrees of freedom interact in non-linear ways. Researchers continue to refine techniques for dimensionality reduction to achieve a more effective visualization that captures the essence of the underlying molecular processes.
Data Quality and Sampling Issues
Another significant challenge is ensuring adequate sampling within molecular dynamics simulations. Incomplete sampling can result in landscapes that do not capture all relevant conformational states or misrepresent the true energy barriers. Efforts to improve sampling, such as enhanced sampling methods and longer simulation times, are critical to obtaining reliable FELs. Additionally, integrating temporal information with spatial energy distributions presents another layer of complexity that researchers are actively addressing.
Integration of FEL Analysis with Machine Learning
Emerging Trends and Innovations
Recent advancements have seen the integration of machine learning techniques with traditional FEL analysis methods. Machine learning algorithms, particularly those focused on clustering and pattern recognition, are being applied to automatically identify and classify regions of interest within the free energy landscape. These approaches can significantly enhance the resolution of FEL representations and provide automated tools for detecting subtle features that might be overlooked with conventional techniques.
Furthermore, deep learning models are proving quite effective in predicting reaction pathways and energy barriers directly from simulation data. Such models reduce the need for manual intervention and enhance the precision of the overall analysis. As these techniques mature, they are expected to revolutionize how FEL data is processed, analyzed, and presented.
Advanced Visualization Approaches
Interactive Visualizations and Real-Time Data Analysis
The latest visualization tools offer interactive interfaces that enable users to manipulate the visualization in real time. Features include rotating three-dimensional plots, zooming into regions of interest, and dynamically updating histograms to reflect changes over simulation time. These capabilities are crucial for exploring complex FELs as they provide a more intuitive understanding of the energy surface and the associated dynamic processes.
Software Demonstrations
Consider software like MD DaVis, which not only generates interactive 3D plots but also overlays trajectory data onto the free energy landscape. This combination of structural data with visual energy mapping enables researchers to connect real molecular movements with their corresponding energetic profiles. A similar contribution comes from Python-based packages dedicated to creating 3D FELs via PCA, which provide detailed insight into time-dependent changes along the energy landscape.
Case Studies and Applications
Protein Folding Landscapes
In the realm of protein folding, free energy landscape analysis has unveiled distinct folding pathways and identified intermediate states that were previously challenging to isolate. By mapping out the energy minima and the low-energy paths between them, researchers are able to propose mechanisms whereby proteins transition from unfolded to folded states. Such studies not only validate simulation techniques but also inform experimental strategies in structural biology.
Molecular Recognition and Drug Design
The insights obtained from FEL analysis extend to the field of drug discovery. An in-depth understanding of the conformational landscape of target biomolecules allows for the identification of potential binding pockets and transitional states that may serve as optimal drug targets. Moreover, mapping the energy barriers between binding sites can provide crucial data on binding kinetics and the stability of drug-target complexes.
Future Directions in FEL Analysis
Bridging Simulations with Experimental Data
One promising avenue for future research is the integration of free energy landscape data with experimental observations. By correlating simulation outputs with laboratory measurements, researchers can refine the accuracy of FEL models and validate theoretical predictions. This cross-validation is vital for advancing both computational and experimental studies in molecular science.
Enhanced Computational Methods
As computational resources and algorithms continue to evolve, new methods for sampling and analyzing high-dimensional FELs are expected to emerge. These methods will likely combine enhanced sampling techniques with machine learning algorithms, paving the way for even more accurate and comprehensive visualizations of molecular dynamics. Such advances promise to drive significant progress in our understanding of complex biomolecular systems.
References
- GitHub - Free Energy Landscape Analysis Tool - GitHub
- MD DaVis Documentation - ReadTheDocs
- Free_Energy_Landscape-MD Python Package - Bioinformatics Review
- Nature Article - Nature
-
ScienceDirect Article - ScienceDirect
Recommended Queries
Last updated March 11, 2025