
Unlocking Algorithm Mastery Through Visual Learning
Explore how dynamic visualizations and interactive tools transform complex algorithms into intuitive, understandable concepts.
Key Highlights of Visual Algorithm Learning
- Enhanced Comprehension: Visualizing algorithms breaks down abstract concepts into tangible, step-by-step processes, significantly aiding understanding for all learners, especially visual learners.
- Interactive Engagement: Many visualization tools offer interactive features, allowing users to manipulate inputs and observe real-time changes, which fosters deeper engagement and experimentation.
- Diverse Application: Visual learning methods are applicable across various algorithm types, from fundamental sorting and searching to complex graph theory and advanced machine learning algorithms.
Understanding algorithms, whether for computer science coursework, coding interviews, or practical application in fields like machine learning and computer vision, can be a challenging endeavor. The abstract nature of algorithmic processes often makes it difficult to grasp how they operate on data. However, visual learning methods offer a powerful solution, transforming complex logical flows into intuitive, observable animations and diagrams. This approach caters effectively to visual learners, who typically absorb information best when they can "see" it in action.
The Power of Algorithm Visualization
Transforming Abstract Logic into Tangible Insights
Algorithm visualization is a pedagogical technique that graphically represents the execution of algorithms. This practice is crucial in computer science education, providing students, educators, and professionals with a clear, step-by-step understanding of how algorithms work through visual means. By observing the dynamic changes in data structures and the flow of operations, learners can build stronger mental models of these abstract concepts.
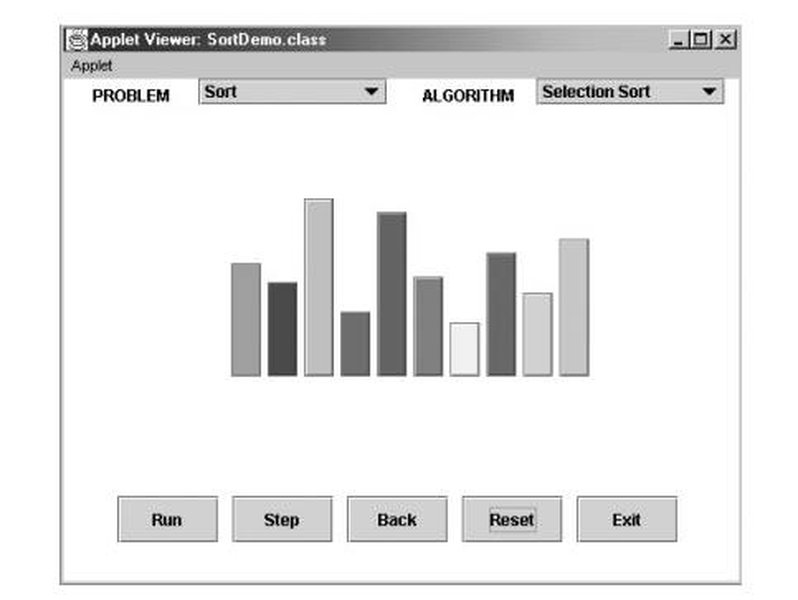
An illustration of the algorithm visualization process.
The core benefit of visualization lies in its ability to dissect an algorithm's operational steps into visual elements that are easy to follow. This not only enhances learning and teaching but also assists in debugging and optimizing algorithms by offering a transparent view of their execution flow and potential inefficiencies. For instance, observing a sorting algorithm in action reveals exactly how elements are compared and swapped, making the efficiency (or inefficiency) of different approaches immediately apparent.
Why Visuals Resonate with Learners
Visual aids significantly boost memory retention and recall. When abstract concepts are paired with visual representations, they become more memorable and easier to retrieve from memory. This is particularly true for complex processes like those found in algorithms. Interactive tools further enhance this by allowing users to manipulate data and instantly see how their changes affect the algorithm's behavior, fostering a deeper, experiential understanding.
Effective Tools and Platforms for Visualizing Algorithms
A Landscape of Interactive Learning Resources
Numerous online platforms and tools have emerged to facilitate the visual learning of algorithms and data structures. These resources cater to different learning styles and levels, from beginners grappling with fundamental concepts to advanced users exploring complex graph algorithms or machine learning models.
| Platform Name | Key Features | Algorithm Categories Covered | Target Audience |
|---|---|---|---|
| VisuAlgo | Interactive animations, custom input, e-Lecture mode, quizzes. Developed by NUS. | Sorting, searching, linked lists, trees (AVL, Red-Black), heaps, graphs (BFS, DFS, Dijkstra), string algorithms, computational geometry. | Students, beginners, those preparing for coding interviews. |
| USFCA Data Structure Visualizations | Interactive animations using HTML5 canvas, wide range of data structures. | Stacks, queues, linked lists, hash tables, various trees (Binary Search, AVL, Red-Black, B-Trees), heaps, graph algorithms (BFS, DFS, Dijkstra, Prim's, Kruskal's). | Computer science students, visual learners. |
| Algorithm Visualizer | Visualize code written in various programming languages, step-by-step execution. | Sorting, pathfinding, data structures, recursion. | Programmers, students wanting to see their code in action. |
| A Visual Introduction to Algorithms (Educative.io) | Articles, visualizations, quizzes, coding challenges, AI Code Mentor. | Searching, sorting, recursion, graph theory. | Beginners in computer science, self-taught developers. |
| CS 1332 Data Structures and Algorithms Visualizations (Georgia Tech) | Official visualization tool for a university course. | Data structures and algorithms covered in CS 1332 curriculum. | Georgia Tech students, general learners interested in structured explanations. |
| Sort Visualizer | Interactive visualizations of over 15 sorting algorithms with different initial conditions. | Bubble Sort, Selection Sort, Insertion Sort, Merge Sort, Quick Sort, etc. | Anyone interested in understanding sorting algorithm performance. |
These platforms often allow users to provide their own inputs, which is a critical feature for truly understanding how an algorithm behaves under different conditions. The ability to pause, rewind, and step through the execution frame by frame allows for meticulous analysis of each operation.
Visualizing Algorithm Performance and Complexity
Beyond Execution: Understanding Efficiency Through Visuals
While seeing an algorithm run is insightful, visualizing its performance characteristics, such as time and space complexity, adds another layer of understanding. A radar chart can effectively compare different algorithms across various performance metrics, offering a holistic view of their strengths and weaknesses. This helps in understanding the trade-offs involved in choosing one algorithm over another for a particular task.
Comparison of Algorithmic Efficiency and Learnability. This radar chart illustrates the perceived ease of understanding and efficiency characteristics across different categories of algorithms. Higher values indicate better performance or easier comprehension.
For instance, a radar chart might show that while Bubble Sort is very easy to visualize and implement, its time complexity is significantly worse than Merge Sort or Quick Sort, especially for large datasets. Such visual comparisons help learners internalize the trade-offs of different algorithms in a quantifiable way, moving beyond just theoretical Big O notation.
Visual Learning in Machine Learning and Computer Vision Algorithms
Making Advanced Concepts Accessible
The principles of visual learning extend powerfully into more advanced domains such as machine learning and computer vision. These fields rely heavily on complex algorithms, and visualizing their operation can demystify intricate processes. For example, understanding how a Convolutional Neural Network (CNN) processes an image, layer by layer, is significantly enhanced by visual tools that show feature extraction and activation maps.
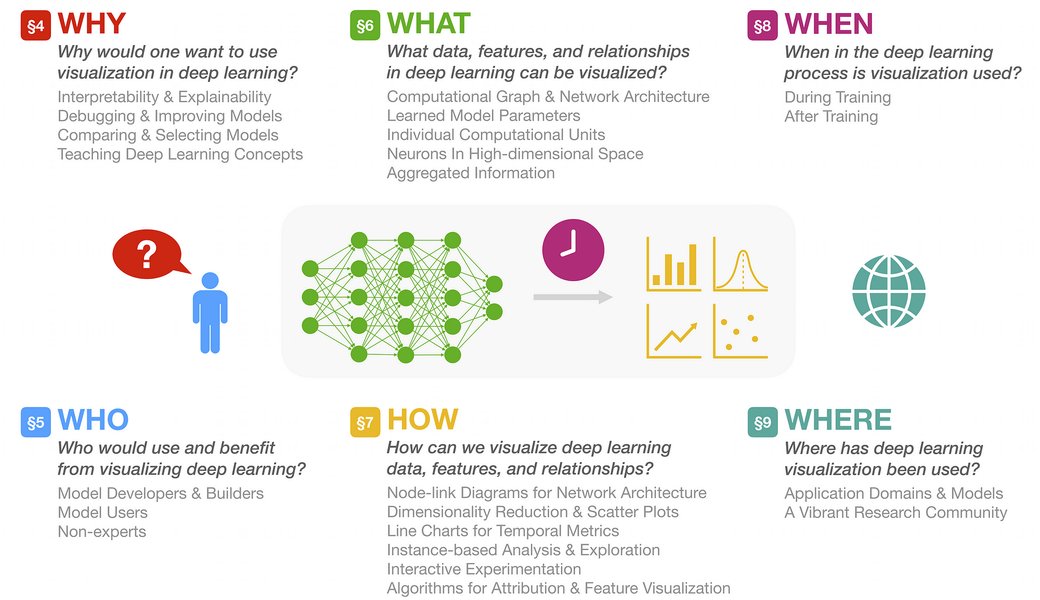
Visualization techniques applied to deep learning models.
Machine learning algorithms, such as linear regression, decision trees, and genetic algorithms, can also be effectively visualized. For example, decision trees can be seen as a series of nodes with tests, where each branch follows a different outcome, providing a clear visual representation of the decision-making process. Similarly, visualizations can show how a genetic algorithm evolves a population of solutions over generations, demonstrating the principles of natural selection in optimization problems.
Computer Vision: Seeing Algorithms in Action
In computer vision, algorithms are designed to enable artificial systems to process and "understand" visual information. Modern computer vision algorithms often leverage deep learning, particularly CNNs, which have dramatically improved performance in tasks like image classification, object detection, and segmentation. Visualizations in this context can show:
- Feature Extraction: How a CNN extracts increasingly complex features from raw pixel data.
- Activation Maps: Which parts of an image a network focuses on for a particular classification.
- Object Tracking: The dynamic process of an algorithm following an object across video frames.
These visual insights are invaluable for debugging, improving, and gaining confidence in the behavior of complex computer vision models. Understanding the internal workings of these algorithms, rather than treating them as black boxes, is critical for both research and practical deployment.
Further Enhancing Learning with Video Resources
Dynamic Explanations for Deeper Insight
Beyond interactive websites and static diagrams, video lectures and tutorials offer another powerful visual learning method. Videos provide narrated, step-by-step walkthroughs of algorithms, often incorporating animations and real-world examples. This can be particularly beneficial for algorithms that involve complex dynamic changes or require a deeper conceptual explanation.
This video, "Check Out These Amazing Algorithm and Data Structure Visualization Tool (VisuAlgo && USFCA CS Dep)," provides an excellent overview and demonstration of two of the leading visualization platforms mentioned, VisuAlgo and the USFCA Data Structure Visualizations. It highlights their interfaces and how they can be used to visually explore various algorithms, making abstract concepts tangible and easier to grasp for learners.
Videos can often articulate the nuances of an algorithm's behavior, such as edge cases or optimization strategies, in a way that static visualizations might not fully capture. They combine auditory explanations with visual cues, appealing to multiple learning modalities and reinforcing comprehension.
Conclusion
The Indispensable Role of Visualization in Algorithmic Understanding
Visual learning methods have undeniably revolutionized how algorithms and data structures are taught and understood. By translating abstract computational processes into dynamic, observable animations and interactive experiences, these methods make complex topics accessible and engaging. For visual learners, this approach is not merely supplementary but often foundational to truly grasping the intricate logic and efficiency of algorithms. From basic sorting to advanced machine learning models, visualization tools provide a clear window into the "how" and "why" of algorithmic operations, fostering deeper comprehension, aiding in debugging, and ultimately enhancing problem-solving abilities in the realm of computer science and beyond. Embracing these visual techniques is key to mastering algorithms in the modern learning landscape.
Frequently Asked Questions
Recommended Searches
- Explore interactive data structure visualizations for deeper insights.
- Discover the best online courses for algorithms with visual learning approaches.
- Find tools that visually explain machine learning algorithms.
- Learn techniques to debug algorithms more effectively using visual methods.