
Market Volatility Ahead: Decoding the VIX's Next-Week Trajectory
Understanding the fear index's potential movements in an uncertain market landscape with crucial signals for informed investment decisions
Key Insights on VIX Trajectory
- Current VIX Status: As of April 3, 2025, the VIX stands at 30.02, significantly above historical averages and indicating heightened market fear
- Short-Term Projections: Technical indicators suggest a 74% probability of erratic movement with a slight 1.72% upward bias over the next 5 days
- Primary Catalysts: Recent market volatility, economic uncertainty, and ongoing tariff impacts are expected to maintain elevated VIX levels through next week
Understanding the VIX's Current State
The CBOE Volatility Index (VIX), often referred to as the "fear gauge," currently sits at 30.02 as of April 3, 2025. This level represents a significant elevation compared to historical norms, indicating substantial market anxiety. The recent market change of 8.51 points (+39.56%) suggests a rapid intensification of expected volatility.
The VIX has nearly doubled from its levels earlier this year, coinciding with the S&P 500's approximately 10% decline from its all-time high reached on February 19, 2025. This inverse relationship between market performance and volatility expectations is a hallmark characteristic of the VIX, which tends to spike during periods of market uncertainty and retreat during bullish conditions.
Technical Indicators for Short-Term Forecast
Technical analysis provides several important signals regarding the VIX's potential trajectory over the coming week:
- The index has recently broken above its 50-day moving average, traditionally a bullish signal for volatility
- Current price action shows the VIX oscillating around the 27-30 range, establishing a potential support zone
- Short-term forecasts suggest a 1.72% increase over the next 5 trading days
- Probability analysis indicates a 74.08% chance of erratic movements without a clear directional trend
- Some analysts have identified price targets in the 22-25 range if volatility subsides
Market Sentiment Analysis
Investor sentiment currently leans cautious, with institutional positioning suggesting hedging activity against potential market downturns. This defensive posturing typically maintains upward pressure on the VIX as market participants purchase protection against adverse price movements in equities.
Factors Influencing Next Week's VIX Movement
Economic Catalysts
Several economic factors are poised to influence the VIX's trajectory in the immediate term:
- Ongoing impacts of recently implemented tariffs, creating uncertainty in global trade
- Inflation concerns weighing on consumer sentiment and spending patterns
- Monetary policy expectations regarding the Federal Reserve's next moves
- Employment data releases scheduled for the coming week
- Corporate earnings announcements that may exceed or fall short of market expectations
Geopolitical Considerations
Geopolitical tensions continue to serve as potential volatility catalysts, with several situations requiring monitoring:
- Ongoing Russia-Ukraine conflict developments
- Trade negotiations between major economic powers
- Potential policy shifts from global central banks
- Energy market fluctuations affecting broader market sentiment
Historical Context for Current Volatility
The first half of 2025 has been characterized by heightened volatility, with market experts consistently projecting turbulence through at least June. This pattern aligns with historical precedent during periods of economic transition and policy uncertainty.
VIX Market Impact Assessment
This radar chart illustrates the current and projected impact of VIX volatility across various market segments. The analysis suggests moderate increases in volatility impacts across all measured dimensions, with equity market decline risk and options premium inflation showing the most significant projected increases. This multi-dimensional view helps understand how VIX movements ripple through interconnected financial markets.
Probability Scenarios for VIX Next Week
| Scenario | VIX Range | Probability | Primary Catalysts |
|---|---|---|---|
| Significant Increase | 35-40+ | 15% | Major negative economic surprise, geopolitical shock, or accelerated market selloff |
| Moderate Increase | 30-35 | 30% | Continued market weakness, disappointing economic data, or policy uncertainty |
| Sideways Movement | 27-30 | 40% | Mixed economic signals, balanced trading flows, maintained uncertainty |
| Moderate Decrease | 22-27 | 12% | Market stabilization, positive economic surprises, reduced geopolitical tensions |
| Significant Decrease | Below 22 | 3% | Strong market rally, major positive economic catalysts, resolution of key uncertainties |
Based on current market conditions and historical VIX behavior, the most probable scenario for the coming week is sideways movement with elevated volatility, with a combined 45% probability of seeing at least moderate increases. The least likely outcome is a significant decrease below 22, which would require substantial positive catalysts that aren't currently evident in the market landscape.
VIX Trajectory: Decision Framework
This mindmap outlines the comprehensive framework for analyzing the VIX's potential trajectory, incorporating technical indicators, market catalysts, historical context, and probability assessments. Each branch represents a key component of the analysis that contributes to the overall projection of sideways movement with an upward bias for the coming week.
Market Anxiety Visualization
Visual indicators of market sentiment provide additional context for understanding the current volatility environment:

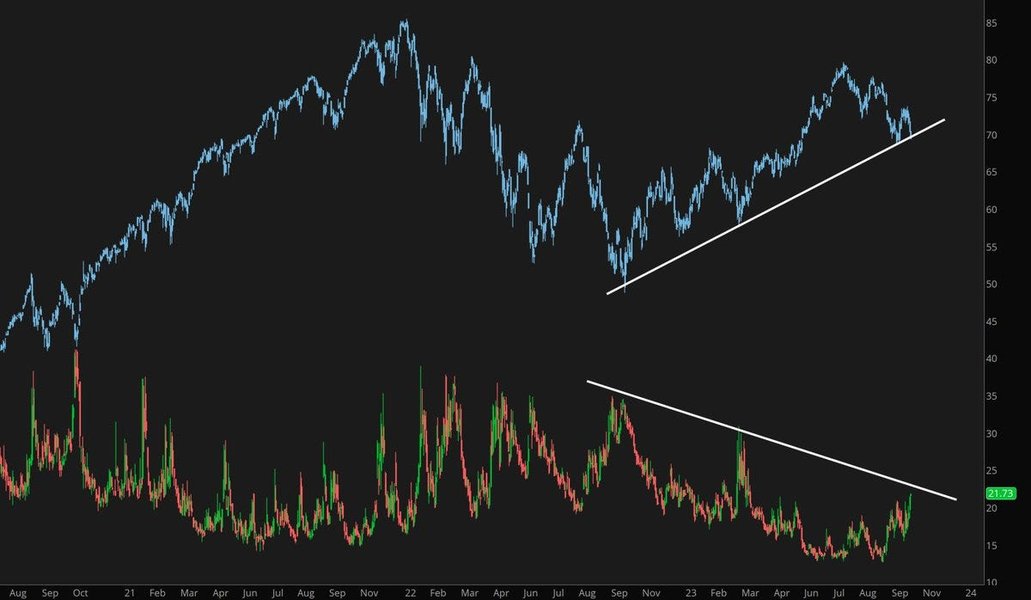
The first image represents the psychological dimension of market volatility, illustrating the financial anxiety experienced by investors during periods of elevated VIX readings. This emotional component often drives market behavior as much as fundamental factors. The second image shows a historical VIX chart pattern, demonstrating how current levels compare to previous volatility events and providing context for potential mean reversion scenarios.
Expert Market Analysis
This analysis from financial experts provides valuable insights into the S&P 500, NDX, and VIX price projections. The video explores current market conditions, technical indicators, and potential scenarios that could influence volatility in the coming week. The comprehensive analysis aligns with our projection of elevated but potentially range-bound volatility, with specific attention to key price levels that could trigger more significant VIX movements if breached.
Frequently Asked Questions
How does the VIX differ from other market indicators?
The VIX is unique among market indicators because it measures implied volatility based on S&P 500 index options rather than actual price movements. While traditional indicators like RSI or MACD measure historical price action, the VIX is forward-looking, reflecting market expectations for volatility over the next 30 days. This makes it particularly valuable for assessing market sentiment and potential turning points, as heightened VIX readings often precede or coincide with significant market movements.
What VIX level would signal extreme market fear?
VIX readings above 30 generally indicate significant market fear, while levels above 40 suggest extreme anxiety. The current reading of 30.02 sits right at the threshold of significant concern. For historical context, during the 2008 financial crisis, the VIX peaked above 80, while the March 2020 COVID-19 market crash saw levels exceed 85. The average VIX reading over the past decade has been approximately 17, making the current level nearly double the long-term average and indicative of substantial market uncertainty.
Can investors directly trade the VIX?
While investors cannot directly trade the VIX index itself, there are numerous derivative products that track VIX movements. These include VIX futures, options on VIX futures, and exchange-traded products (ETPs) like VXX or UVXY. However, these instruments have complex behaviors due to factors like contango and time decay, making them more suitable for sophisticated investors with a thorough understanding of volatility products. Many retail investors use these products for short-term hedging rather than long-term investment due to their tendency to lose value during periods of market stability.
Is the current VIX level predictive of a market correction?
The current VIX level of 30.02 indicates elevated market anxiety but isn't necessarily predictive of an imminent correction. While there's a historical correlation between high VIX readings and market downturns, the relationship isn't perfectly predictive. The VIX can remain elevated during periods of uncertainty without triggering further market declines, particularly if the initial spike already coincided with a market pullback (as we've seen with the recent 10% drop from February highs). Rather than predicting future corrections, the current VIX level better reflects the market's assessment of near-term risks and uncertainty.
How do professional traders use VIX in their strategies?
Professional traders incorporate the VIX into their strategies in several ways. Many use it as a sentiment indicator, with extreme readings potentially signaling contrarian opportunities. Others employ VIX derivatives for portfolio hedging, increasing exposure during low-volatility periods and reducing it when the VIX spikes. Some volatility-focused strategies involve pairs trading between the VIX and S&P 500, exploiting their typically inverse relationship. Additionally, option traders closely monitor VIX movements to optimize the timing of their positions, as higher VIX readings generally coincide with higher option premiums across the market.
References
- 5 factors causing market volatility now - Fidelity
- Is this a market correction? - U.S. Bank
- Stock Market Outlook For 2025: What Investors Can Expect - Forbes
- TradingView VIX Ideas and Analysis - TradingView
- VIX Live Prices and Market News - FX Empire
-
VIX Overview and Market Trends - MarketWatch
- VIX 10-Day Price Predictions and Analysis - Predict Price
Recommended Searches
Last updated April 3, 2025