
Understanding Annualized Inflation: A Comprehensive Guide
Deciphering the Impact of a 0.64% Monthly Inflation Rate on Your Purchasing Power
Inflation is a fundamental economic concept that impacts everyone, from individual consumers to large corporations. It refers to the rate at which the general level of prices for goods and services is rising, and consequently, the purchasing power of currency is falling. When you hear about inflation, it's typically expressed as a percentage increase over a given period, most commonly on an annual basis.
A single monthly inflation rate, such as 0.64%, might seem small on its own. However, when annualized, its cumulative effect can be significant. Annualizing a monthly rate means projecting its impact over a full 12-month period, assuming the same rate of increase continues each month. This allows for a more realistic understanding of how price changes accumulate over a longer duration and their broader economic implications.
Key Insights into Annualized Inflation
- Compounding Effect: A seemingly small monthly inflation rate, when annualized, reveals a much larger impact due to the compounding of prices over 12 months.
- Purchasing Power Erosion: Understanding annualized inflation is crucial for assessing the real decline in the value of your money over time, affecting savings, investments, and daily expenditures.
- Economic Barometer: Annualized inflation figures are vital for policymakers, businesses, and individuals to make informed decisions regarding wages, pricing, investments, and monetary policy.
Decoding the Inflation Rate: What It Means
Inflation is essentially the pace at which prices are rising across an economy. It's not just about a single item becoming more expensive; it's a broad increase in the cost of a "basket" of goods and services that households typically buy. This increase diminishes the purchasing power of your money, meaning that the same amount of currency buys fewer goods and services over time.
The rate of inflation is typically expressed as a percentage. For example, if the inflation rate is 2%, it means that a basket of goods that cost $100 a year ago would now cost $102. Understanding this rate is crucial because it affects almost every aspect of economic life, from consumer spending habits to national economic policies.
Measuring Inflation: The Consumer Price Index (CPI)
In the United States, one of the most widely used measures of inflation is the Consumer Price Index (CPI), published monthly by the Bureau of Labor Statistics (BLS). The CPI tracks the average change in prices paid by urban consumers for a comprehensive basket of consumer goods and services, including food, housing, transportation, and medical care. The CPI serves as a crucial barometer for overall inflation within the economy.
Other measures also exist, such as the Personal Consumption Expenditures (PCE) Price Index, which is preferred by the Federal Reserve. While both CPI and PCE serve the same purpose of tracking price changes, they differ in their scope and methodology. CPI focuses on consumer out-of-pocket expenses, while PCE includes a broader range of goods and services purchased by households and on their behalf by non-profits.

A visual comparison highlighting the differences between the Consumer Price Index (CPI) and the Personal Consumption Expenditures (PCE) Price Index.
The Calculation of Annualized Inflation
To annualize a monthly inflation rate, you essentially project its impact over a full year, assuming the rate remains consistent. This is done through compounding, as the price increases in one month build upon the previous month's increased prices.
Formula for Annualizing Monthly Inflation
The formula for calculating an annualized inflation rate from a monthly rate is as follows:
\[ \text{Annualized Inflation Rate} = ((1 + \text{Monthly Inflation Rate})^{12} - 1) \times 100\% \]Let's apply this formula to your query of a 0.64% monthly inflation rate. First, convert the percentage to a decimal: \(0.64\% = 0.0064\).
\[ \text{Annualized Inflation Rate} = ((1 + 0.0064)^{12} - 1) \times 100\% \] \[ \text{Annualized Inflation Rate} = ((1.0064)^{12} - 1) \times 100\% \]Calculating \((1.0064)^{12}\):
\[ (1.0064)^{12} \approx 1.0795 \]Now, plug this back into the formula:
\[ \text{Annualized Inflation Rate} = (1.0795 - 1) \times 100\% \] \[ \text{Annualized Inflation Rate} = 0.0795 \times 100\% \] \[ \text{Annualized Inflation Rate} = 7.95\% \]Therefore, a monthly inflation rate of 0.64% would annualize to approximately 7.95%. This demonstrates the significant impact of compounding, turning a seemingly small monthly increase into a notable annual figure.
The Importance of Annualization
Annualizing a monthly rate provides a more comprehensive perspective on inflation. While a 0.64% monthly increase might seem negligible, an almost 8% annual rate indicates a substantial erosion of purchasing power over the course of a year. This figure is critical for:
- Consumers: To understand how much more expensive goods and services might become over a year and plan their budgets accordingly. For example, if food prices continue to increase at this rate, your grocery bill could be significantly higher by the end of the year.
- Businesses: To adjust pricing strategies, wage negotiations, and investment plans to account for rising costs.
- Policymakers: Central banks like the Federal Reserve monitor annualized inflation closely to guide monetary policy decisions, such as adjusting interest rates, to control price stability.
Understanding Recent Inflation Trends and Projections
Recent years have seen fluctuating inflation rates, with significant spikes in 2021 and 2022. For instance, the annual inflation rate in the U.S. reached a four-decade peak of 9.1% in June 2022. Since then, inflation has shown signs of cooling, with the annual rate for the 12 months ending April 2025 reported at 2.3%.
While the overall trend has been downward, certain sectors continue to experience notable price increases. For example, rent has been a key driver of inflation, although its monthly increase cooled to 0.3% between March and April 2025. Beef and veal prices are also predicted to increase in 2025 due to tight supplies and sustained consumer demand. Conversely, some categories like grocery prices, eggs, and airline fares have recently seen declines.
Historical Context of US Inflation Rates (2020-2025)
The following table provides a snapshot of recent annual inflation rates in the United States, highlighting the volatility observed in the post-pandemic era and the projected rates for 2025:
| Year | Annual Inflation Rate (December, %) | Average Annual Inflation Rate (%) |
|---|---|---|
| 2020 | 1.4 | 1.4 |
| 2021 | 7.0 | 4.7 |
| 2022 | 6.5 | 8.0 |
| 2023 | 3.1 | 4.1 |
| 2024 (Projected) | 2.9 | - |
| 2025 (Projected) | 3.0 (January) | - |
Note: The 2024 and 2025 figures are projections based on available data. The average annual inflation rate for a given year is calculated using CPI data for the entire year.
This table illustrates the significant increase in inflation in 2021 and 2022, followed by a moderation in 2023 and projections of more stable, though still positive, rates for 2024 and 2025. The 0.64% monthly rate, when annualized, results in an approximate 7.95% annual rate, which is higher than the projected annual rates for 2024 and 2025, suggesting that if this monthly rate persists, it would represent a significant re-acceleration of inflation.
Factors Influencing Inflationary Pressures
Inflation is a complex phenomenon influenced by various factors:
- Demand-Pull Inflation: Occurs when there is too much money chasing too few goods, leading to an increase in overall demand that outstrips supply.
- Cost-Push Inflation: Happens when the cost of producing goods and services rises, such as increases in raw material prices (like oil) or labor costs, which businesses then pass on to consumers through higher prices.
- Monetary Policy: Decisions by central banks, such as adjusting interest rates, can significantly influence the money supply and credit availability, thereby impacting inflation. Raising interest rates typically makes borrowing more expensive, slowing down spending and potentially curbing inflation.
- Supply Chain Disruptions: Events like geopolitical conflicts or natural disasters can disrupt supply chains, leading to shortages and higher prices.
- Inflation Expectations: If consumers and businesses expect prices to rise, they may adjust their behavior (e.g., demanding higher wages, raising prices), which can contribute to actual inflation.
The Real-World Impact of Inflation
Understanding annualized inflation is not just an academic exercise; it has tangible effects on daily life and long-term financial planning.
Erosion of Purchasing Power
The most direct impact of inflation is the erosion of purchasing power. If your income does not keep pace with inflation, your real income effectively decreases, meaning you can afford less with the same amount of money. This disproportionately affects lower and middle-income households, who spend a larger proportion of their income on necessities like housing, food, and transportation.
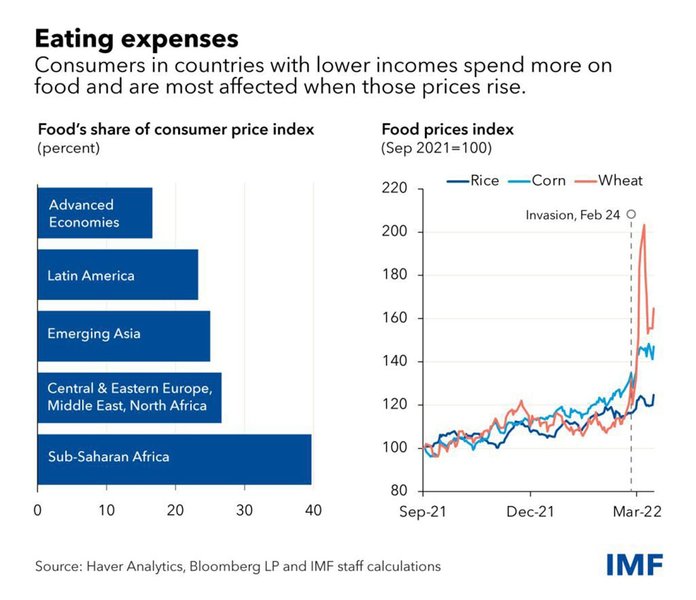
Rising food prices, a direct consequence of inflation, significantly impact household budgets, especially for vulnerable populations.
Investment and Savings Considerations
Inflation also impacts savings and investments. If the inflation rate is higher than the interest rate earned on savings accounts, the real value of those savings decreases over time. For example, if you have $50,000 in a checking account that earns no interest and the inflation rate is 2.5%, you would lose $1,250 in real value by the end of the year.
Conversely, those with tangible assets, such as real estate or commodities, might see the value of their assets increase during periods of inflation, potentially offering a hedge against the erosion of currency value.
The Role of Interest Rates in Combating Inflation
Central banks often use interest rates as a primary tool to manage inflation. By raising the federal funds rate, they make borrowing more expensive, which can slow down consumer and business spending. This reduction in demand can help supply chains catch up and potentially lead to a drop in prices, thereby curbing inflation. However, this strategy must be carefully balanced to avoid unintended consequences, such as a recession.
Comparing Monthly and Annual Inflation Rates
To further illustrate the concept, let's visualize the difference between a monthly inflation rate and its annualized counterpart, along with other economic indicators and their perceived stability. This radar chart will compare how stable different economic factors are perceived, with a higher score indicating greater stability.
This radar chart illustrates the perceived stability of various economic indicators, comparing a monthly inflation rate to its annualized counterpart and other factors influencing economic outlook. A higher score indicates greater stability.
As the radar chart illustrates, a monthly inflation rate can appear relatively stable in isolation, but its annualized counterpart (7.95% from our calculation) presents a far more dynamic and less stable picture. This chart helps to visually reinforce why annualized figures are often more representative of the true impact of inflation on economic stability and individual financial health. Factors like interest rate stability and employment growth are often seen as more predictable than short-term inflation fluctuations.
Further Exploration: How CPI is Used to Calculate Inflation
To delve deeper into the mechanics of how inflation is calculated using the Consumer Price Index (CPI), this video provides a detailed explanation. It covers the methodology, data sources, and practical application of CPI in determining inflation rates.
This video by Ryan O'Connell, CFA, FRM, offers a hands-on guide to calculating inflation rate and Consumer Price Index (CPI), illustrating the practical application of the economic concepts discussed.
Frequently Asked Questions
What is inflation?
How is inflation typically measured?
Why is it important to annualize monthly inflation rates?
What is the difference between inflation and deflation?
How does high inflation affect different income households?
Conclusion
A monthly inflation rate of 0.64% may appear modest at first glance, but when annualized, it translates to a significant rate of approximately 7.95%. This calculation underscores the critical concept of compounding and how seemingly small incremental changes can lead to substantial shifts in purchasing power over a year. Understanding annualized inflation is essential for consumers, businesses, and policymakers alike to make informed financial and economic decisions, plan for future expenses, and navigate the complex dynamics of price stability. As global and domestic factors continue to influence economic conditions, closely monitoring and comprehending inflation rates remains paramount for financial well-being and economic health.
Recommended Further Queries
- How is the Consumer Price Index calculated and used to measure inflation?
- What are the primary causes of inflation and how do they impact the economy?
- What are the strategies individuals can employ to protect their savings from inflation?
- How do central banks use monetary policy to control inflation rates?
References
Last updated May 21, 2025