
Unlocking Phenolic Compound Quantification: Your Comprehensive Guide to Building an Accurate Calibration Curve
Master the art of preparing reliable calibration curves for phenolic analysis using spectrophotometric methods.
Building a calibration curve is a cornerstone technique for the quantitative analysis of phenolic compounds in various samples, from plant extracts to food products and beverages. This process typically involves a spectrophotometric method, most commonly the Folin-Ciocalteu (F-C) assay, which measures the total phenolic content. An accurate calibration curve establishes a precise relationship between known concentrations of a standard compound (like Gallic acid) and their corresponding absorbance readings, enabling the determination of phenolic concentrations in unknown samples.
Essential Highlights for Your Calibration Curve
- Standard Selection is Key: Gallic acid is the most widely accepted standard for total phenolic content determination, offering consistent results. However, depending on your specific matrix or target compounds, other standards like catechin or oleuropein might be considered.
- Precision in Preparation: Accurate weighing of the standard, precise preparation of stock and serial dilution solutions, and consistent reagent handling are crucial for a linear and reliable calibration curve.
- The Folin-Ciocalteu Reaction: This assay relies on the reduction of the Folin-Ciocalteu reagent by phenolic compounds under alkaline conditions, producing a blue-colored complex whose intensity is measured spectrophotometrically, typically around 765 nm.
The Foundation: Materials and Reagents
Before embarking on the construction of your calibration curve, ensure you have the necessary materials and reagents at hand. Accuracy in this preparatory phase is paramount for reliable results.
Essential Components:
- Standard Phenolic Compound: Gallic acid is the most common choice. Ensure high purity.
- Folin-Ciocalteu (F-C) Reagent: Typically diluted (e.g., 10-fold) with distilled water before use.
- Sodium Carbonate (Na₂CO₃) Solution: Anhydrous sodium carbonate dissolved in distilled water (e.g., 7.5% w/v or 20% w/v, depending on the protocol). This provides the alkaline medium necessary for the colorimetric reaction.
- Solvent: Distilled water, methanol, or a hydroalcoholic solution for dissolving the standard and preparing dilutions.
- Spectrophotometer: Capable of measuring absorbance at the required wavelength (typically 760-765 nm).
- Glassware: Volumetric flasks, pipettes (micropipettes and serological), beakers, and test tubes or microplate wells. Ensure they are clean and, if necessary, calibrated.
- Cuvettes: Appropriate for your spectrophotometer (glass or quartz, depending on the wavelength).
- Analytical Balance: For accurately weighing the standard compound.
- Incubation Equipment: A water bath or incubator if temperature control is critical for your protocol, though room temperature is often sufficient.
- Timer: For precise control of incubation periods.
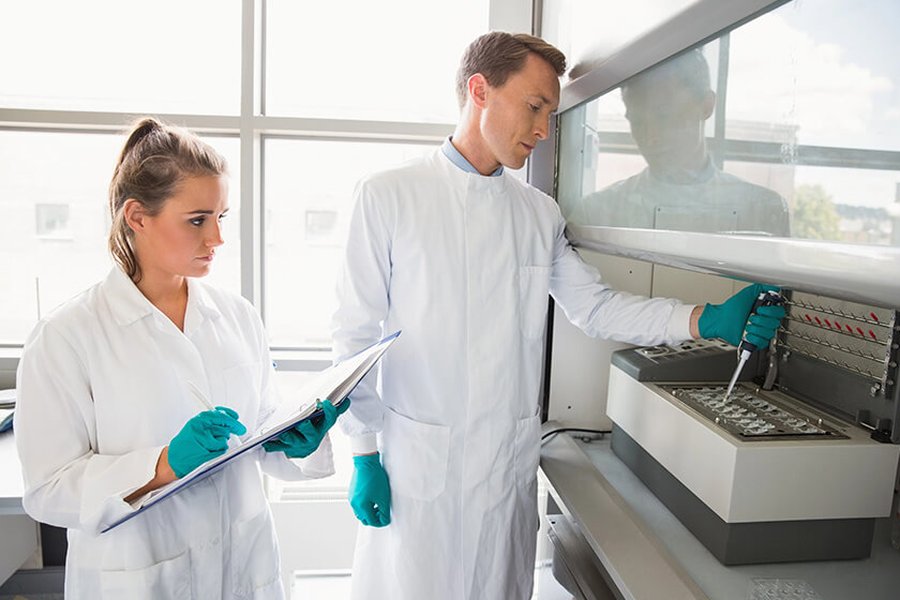
Precision pipetting is crucial for accurate standard dilutions.
Step-by-Step Guide to Constructing Your Calibration Curve
Follow these detailed steps to build a robust and accurate calibration curve for phenolic compound analysis.
Step 1: Selecting and Preparing the Standard Compound
Choosing Your Standard
Gallic acid is overwhelmingly the preferred standard for total phenolic content determination due to its broad reactivity profile with the F-C reagent, resembling many common phenolic structures. Results are often expressed as Gallic Acid Equivalents (GAE). However, if your research focuses on a specific class of phenolics, using a representative standard from that class (e.g., catechin for flavan-3-ols, rutin for flavonols, or oleuropein for secoiridoids) might provide more contextually relevant data. Always ensure consistency with established literature or the specific method you are adapting.
Preparing the Stock Solution
Accuracy begins here. To prepare a stock solution (e.g., 1 mg/mL or 1000 µg/mL Gallic acid):
- Accurately weigh a precise amount of the standard compound (e.g., 10 mg of Gallic acid) using an analytical balance.
- Dissolve the weighed standard in a known volume of a suitable solvent (e.g., distilled water, 50% methanol, or another appropriate solvent system) in a volumetric flask. For instance, dissolving 10 mg in 10 mL of solvent yields a 1 mg/mL stock solution.
- Ensure complete dissolution. Gentle warming or sonication might be necessary for some standards but check for stability under such conditions.
- Store the stock solution appropriately. If not used immediately, refrigerate or freeze in small aliquots to prevent degradation, typically in a dark container to protect from light. Freshly prepared stock solutions are always recommended for best results.
Step 2: Creating a Series of Standard Dilutions
From your accurately prepared stock solution, create a series of standard solutions with decreasing concentrations. This series will form the data points for your calibration curve.
- Determine Concentration Range: The concentrations should span the expected range of phenolic content in your samples and fall within the linear response range of the F-C assay and your spectrophotometer (typically, absorbance values should be below 0.7-1.0 to maintain linearity).
- Example Dilution Series (using a 1000 µg/mL Gallic acid stock): You might prepare standards at 0 µg/mL (blank), 10 µg/mL, 20 µg/mL, 40 µg/mL, 60 µg/mL, 80 µg/mL, and 100 µg/mL. Other common ranges are 0-1 mg/mL or 50-450 µg/mL.
- Precise Dilutions: Use calibrated micropipettes and volumetric flasks for making dilutions. For example, to make 10 mL of a 100 µg/mL standard from a 1000 µg/mL stock, you would take 1 mL of stock and dilute it to 10 mL with the solvent.
- Include a Blank: The "0 µg/mL" standard, or blank, will contain all reagents except the phenolic standard. This is used to zero the spectrophotometer and account for any background absorbance from the reagents themselves.
Step 3: Performing the Folin-Ciocalteu Assay
This is the colorimetric reaction step. The exact volumes and incubation times can vary slightly based on the specific protocol (e.g., cuvette-based vs. microplate reader method), so always refer to a validated procedure.
Typical Reaction Setup (for each standard dilution and your samples):
- Aliquot Standard/Sample: Pipette a specific volume of each standard dilution (and your prepared sample extracts) into separate test tubes or microplate wells (e.g., 20 µL, 100 µL, or 1 mL).
- Add Diluent (if necessary): Often, distilled water is added to bring the volume to a certain point before reagent addition (e.g., if starting with 20 µL of standard, add 1.58 mL of water for a specific protocol).
- Add Folin-Ciocalteu Reagent: Add a defined volume of the diluted F-C reagent (e.g., 100 µL or 5 mL, depending on total reaction volume). Mix well (e.g., by vortexing).
- Incubate (First Stage): Allow the mixture to stand for a short period (e.g., 3-8 minutes) at room temperature. This allows the initial reaction between easily oxidizable substances and the reagent.
- Add Sodium Carbonate Solution: Add a specific volume of the sodium carbonate solution (e.g., 300 µL or 4 mL of 7.5% or 20% Na₂CO₃). This raises the pH, facilitating the reduction of the phosphomolybdate-phosphotungstate complex by phenolic compounds, leading to the characteristic blue color development. Mix thoroughly.
- Incubate (Second Stage - Color Development): Incubate the mixture for a defined period (e.g., 30 minutes, 60 minutes, or even up to 2 hours) at room temperature or a controlled temperature (e.g., 40°C), typically in the dark to prevent photodegradation of the colored complex. The incubation time is crucial for complete color development.
Step 4: Measuring Absorbance
- Set Spectrophotometer Wavelength: Set the spectrophotometer to the appropriate wavelength, typically 760 nm or 765 nm for the Folin-Ciocalteu assay.
- Zero the Instrument: Use the blank solution (containing all reagents but no phenolic standard) to zero the spectrophotometer (set absorbance to 0.000).
- Measure Absorbance: Measure the absorbance of each standard solution and your unknown samples. Ensure readings are taken after the specified incubation period and are stable. If using a microplate reader, readings for all wells are typically taken simultaneously.
- Record Data: Carefully record the absorbance values for each corresponding standard concentration. It's good practice to run standards in triplicate to assess reproducibility.
Ensure that the absorbance values for your standards and samples fall within the linear dynamic range of your spectrophotometer. If absorbances are too high (e.g., >1.0 or >0.7 as some protocols suggest), dilute the sample or standard and re-assay.
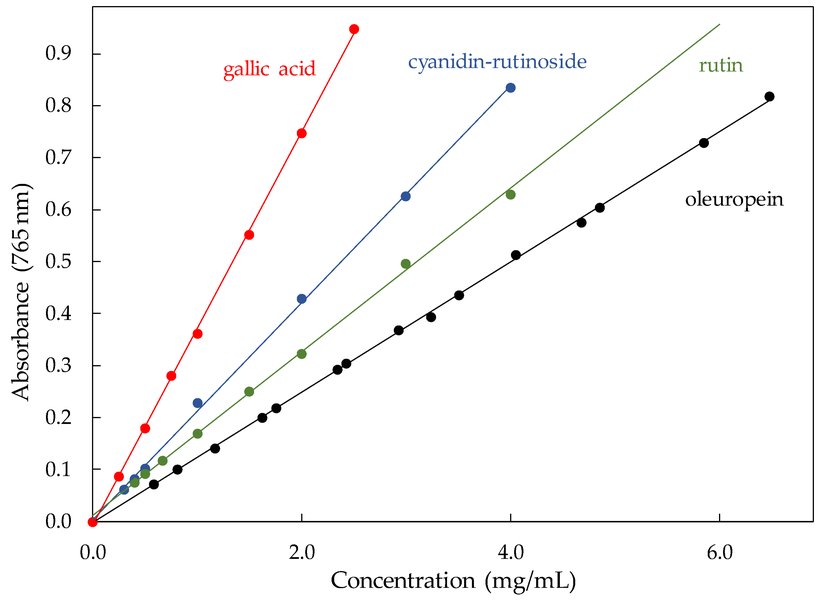
An example showing calibration curves for Gallic acid and other phenolic standards using the Folin-Ciocalteu method.
Step 5: Plotting the Calibration Curve and Performing Linear Regression
- Plot Data: Create a scatter plot with the known concentrations of the standard solutions on the x-axis and their corresponding mean absorbance values on the y-axis.
- Linear Regression: Perform a linear regression analysis on these data points. Most spreadsheet software (like Microsoft Excel) or statistical packages (like GraphPad Prism) can do this.
- Obtain Equation: The analysis will yield a linear equation of the form:
\[ y = mx + b \]
Where:
- \(y\) = Absorbance
- \(x\) = Concentration of the standard (e.g., in µg/mL or mg/mL)
- \(m\) = Slope of the line (represents the sensitivity of the assay)
- \(b\) = y-intercept (ideally close to zero, representing the absorbance of the blank)
- Assess Linearity (R²): Evaluate the goodness of fit by checking the coefficient of determination (R²). A value of 0.99 or higher (e.g., R² ≥ 0.995) is generally considered to indicate good linearity and a reliable calibration curve.
Step 6: Validating the Curve (Optional but Recommended)
For rigorous analytical work, validation parameters should be assessed:
- Limit of Detection (LOD): The lowest concentration of analyte that can be reliably detected.
- Limit of Quantification (LOQ): The lowest concentration of analyte that can be quantified with acceptable precision and accuracy.
- Repeatability: Assessed by running replicates of standards and samples; relative standard deviation (RSD) should typically be low (e.g., <5%).
Step 7: Determining Phenolic Content in Unknown Samples
- Measure Sample Absorbance: Process your unknown samples using the exact same Folin-Ciocalteu procedure as used for the standards and measure their absorbance.
- Calculate Concentration: Use the equation of your calibration curve (\(y = mx + b\)) to determine the concentration of phenolic compounds in your sample extract. Rearrange the formula to solve for \(x\): \[ x = \frac{(y - b)}{m} \] Where \(y\) is the measured absorbance of your sample.
- Account for Dilutions: If your sample extract was diluted prior to the assay, you must multiply the calculated concentration (\(x\)) by the dilution factor (DF) to get the concentration in the original extract. \[ \text{Concentration in original extract} = x \times \text{DF} \]
- Express Results: The total phenolic content is typically expressed as milligrams of Gallic Acid Equivalents per gram of dry weight of the sample (mg GAE/g DW), or per milliliter of liquid sample (mg GAE/mL), or other relevant units. The formula often looks like:
\[ \text{TPC (mg GAE/g)} = \frac{(c \times V)}{W} \]
Where:
- \(c\) = concentration of phenolics from the calibration curve (e.g., in mg/mL)
- \(V\) = volume of the extract (e.g., in mL)
- \(W\) = weight of the dry sample used for extraction (e.g., in g)
Visualizing Key Factors for Accurate Calibration
The success of your phenolic compound quantification heavily relies on several critical factors during the calibration process. The radar chart below illustrates the relative importance of these factors. A higher score indicates greater impact on the accuracy and reliability of your calibration curve.
As shown, meticulous Dilution Accuracy is paramount, closely followed by Standard Purity, Spectrophotometer Calibration & Precision, and ensuring sample readings fall within the Linear Range Adherence. While all factors are important, these have a particularly strong influence on the final outcome.
Summary of Typical Calibration Curve Construction Steps
The following table outlines the key steps involved in building a calibration curve for phenolic compounds using the Folin-Ciocalteu method with Gallic acid as a standard. Note that specific volumes and concentrations can vary based on the chosen protocol.
| Step No. | Description | Typical Details / Example |
|---|---|---|
| 1 | Prepare Standard Stock Solution | Gallic acid, e.g., 1 mg/mL (1000 µg/mL) in distilled water or 50% methanol. |
| 2 | Prepare Standard Dilutions | Serial dilutions, e.g., 0, 10, 20, 40, 60, 80, 100 µg/mL from stock. Include a blank (0 µg/mL). |
| 3 | Reaction Setup: Aliquot Standard | Pipette a fixed volume of each standard (e.g., 20 µL or 100 µL) into test tubes/wells. |
| 4 | Reaction Setup: Add Reagents | Add Folin-Ciocalteu reagent (e.g., 100 µL or 5 mL, 10-fold diluted) and mix. After a short incubation (3-8 min), add sodium carbonate solution (e.g., 300 µL or 4 mL of 7.5% or 20% Na₂CO₃) and mix. |
| 5 | Incubation for Color Development | Incubate in the dark at room temperature (or specified temperature) for 30-60 minutes (or longer, per protocol). |
| 6 | Measure Absorbance | Read absorbance at ~765 nm (or 760 nm) using a spectrophotometer, after zeroing with the blank. |
| 7 | Plot Calibration Curve | Plot Absorbance (y-axis) vs. Concentration (x-axis). |
| 8 | Perform Linear Regression | Determine the equation \(y = mx + b\) and the R² value (aim for ≥0.99). |
| 9 | Analyze Unknown Samples | Process samples identically, measure absorbance, and use the curve equation to calculate phenolic concentration. |
Visualizing the Workflow: A Mindmap
To better understand the interconnected stages of building and using a calibration curve for phenolic compounds, the following mindmap provides a visual overview of the entire process, from initial preparations to final data application.
(e.g., Gallic Acid)"] id1b["Prepare Stock Solution
(Known Concentration)"] id1c["Create Serial Dilutions
(Range of Concentrations)"] id1d["Prepare Reagents
(Folin-Ciocalteu, Na₂CO₃)"] id2["Phase 2: Assay Procedure"] id2a["Reaction Setup
(Mix standards/samples with reagents)"] id2b["Incubation
(Color Development)"] id2c["Measure Absorbance
(Spectrophotometer at ~765 nm)"] id3["Phase 3: Data Analysis & Curve Construction"] id3a["Plot Data
(Absorbance vs. Concentration)"] id3b["Linear Regression
(Obtain y=mx+b)"] id3c["Evaluate Linearity
(Check R² value)"] id3d["Validate Curve (Optional)
(LOD, LOQ)"] id4["Phase 4: Application"] id4a["Analyze Unknown Samples
(Measure Absorbance)"] id4b["Calculate Concentration
(Using curve equation)"] id4c["Account for Dilutions & Sample Weight"] id4d["Express Results
(e.g., mg GAE/g sample)"]
This mindmap highlights the systematic approach required, emphasizing that each phase builds upon the accuracy of the previous one.
Watch and Learn: Estimating Total Phenolics
Visual demonstrations can greatly aid in understanding laboratory procedures. The video below provides a helpful walkthrough of the estimation of total phenolics using the Folin-Ciocalteu method, including aspects relevant to standard graph preparation. It offers insights into the practical execution of the steps discussed.
This video, titled "Estimation of Total Phenolics by FC method with standard ...", demonstrates the principle and procedure for analyzing total phenolics in plant samples, covering the Folin-Ciocalteu method and standard graph preparation. Watching such a demonstration can clarify reagent handling, incubation, and measurement steps, complementing the written guide.
Important Considerations and Best Practices
Minimizing Interferences
The Folin-Ciocalteu reagent is not entirely specific to phenolic compounds. It can also react with other reducing substances present in the sample matrix, such as certain amino acids (e.g., tyrosine, tryptophan), proteins, sugars, ascorbic acid, and some inorganic ions. This can lead to an overestimation of the true phenolic content. To mitigate this:
- Sample Preparation: Employ appropriate extraction and purification techniques (e.g., solid-phase extraction) if significant interferences are suspected.
- Blank Correction: Always run a sample blank that has gone through all extraction steps but without the F-C reaction to account for inherent sample color.
- Understand Limitations: Acknowledge that the F-C assay measures total reducing capacity, often reported as "total phenolic content" with this caveat. For specific phenolic compound identification and quantification, chromatographic methods like HPLC are necessary.
Maintaining Consistency
- Temperature and Light: Perform reactions at a consistent temperature and protect solutions (especially the F-C reagent and the colored complex) from direct light to prevent degradation and ensure reproducibility.
- Timing: Adhere strictly to specified incubation times for all standards and samples.
- Reagent Quality: Use fresh or properly stored reagents. The F-C reagent, in particular, can degrade over time.
- Pipetting: Use calibrated pipettes and consistent pipetting techniques to ensure volume accuracy.
Applications and Interpretation
Calibration curves for phenolic compounds are crucial in various fields:
- Food Science: Assessing the quality and authenticity of foods like wine, olive oil, tea, and fruit juices. Phenolic content often correlates with antioxidant activity, flavor, and color.
- Pharmaceutical and Nutraceutical Research: Quantifying phenolics in plant extracts for developing new drugs or dietary supplements.
- Agricultural Science: Studying the impact of growing conditions or stress factors on plant secondary metabolite production.
Remember that results are expressed as equivalents of the standard used (e.g., Gallic Acid Equivalents). This provides a relative measure of total phenolics rather than an absolute quantification of individual compounds.
Frequently Asked Questions (FAQ)
What is the Folin-Ciocalteu reagent and how does it work?
The Folin-Ciocalteu (F-C) reagent is a mixture of phosphomolybdate and phosphotungstate acids. In an alkaline environment (typically achieved by adding sodium carbonate), phenolic compounds (and other reducing substances) reduce these metallic acids to a blue-colored molybdenum-tungsten complex. The intensity of this blue color is proportional to the amount of reducing substances present and can be measured spectrophotometrically, usually at around 765 nm.
Why is Gallic Acid typically used as a standard?
Gallic acid (3,4,5-trihydroxybenzoic acid) is widely used as a standard for several reasons:
- It is a simple, stable phenolic acid.
- It gives a reliable and reproducible colorimetric response with the F-C reagent.
- Its structure is representative of a basic phenolic unit, making it a good general reference for "total phenolic content."
- It is commercially available in high purity and is relatively inexpensive.
What does "GAE" (Gallic Acid Equivalents) mean?
GAE stands for Gallic Acid Equivalents. When the total phenolic content of a sample is determined using the Folin-Ciocalteu method with Gallic acid as the calibration standard, the result indicates that the reducing capacity of the sample is equivalent to a certain amount of Gallic acid. For example, if a sample has a TPC of 10 mg GAE/g, it means that 1 gram of the sample has the same reducing power towards the F-C reagent as 10 milligrams of pure Gallic acid under the assay conditions.
What is considered a good R² value for a calibration curve?
The coefficient of determination (R²) indicates how well the data points fit the linear regression line. For analytical calibration curves, an R² value of 0.99 or higher is generally considered good, indicating a strong linear relationship between concentration and absorbance. Many guidelines suggest R² ≥ 0.995 as a target for high-quality calibration. A lower R² value might suggest issues with standard preparation, reagent stability, instrumental error, or that the concentration range chosen is not linear.
What should I do if my sample's absorbance is outside the linear range of the curve?
If a sample's absorbance reading is higher than the highest point of your calibration curve (i.e., outside the linear range), you should dilute the sample extract with the appropriate solvent and re-assay it. The obtained concentration must then be multiplied by the dilution factor to get the actual concentration in the original sample. Conversely, if the absorbance is too low (near or below the LOD), you might need to concentrate your sample or use a larger sample volume for extraction, if feasible. Extrapolating beyond the calibrated range can lead to inaccurate results.
Recommended Further Exploration
To deepen your understanding of phenolic compound analysis, consider exploring these related queries:
- How do different solvents affect the extraction efficiency of phenolic compounds?
- What are the common interferences in the Folin-Ciocalteu assay and how can they be minimized?
- Comparison of Folin-Ciocalteu method with HPLC for phenolic compound quantification.
- How to calculate Limit of Detection (LOD) and Limit of Quantification (LOQ) for a calibration curve?
References
Last updated May 9, 2025