
AI Server Rack Power: Four DGX H100 Systems, kW and Monthly kWh
Separate maximum ratings, hypothetical average draw, rack IT load, facility overhead and electricity charges.
Calculate AI server rack power and monthly electricity with explicit system, IT and facility boundaries. Four NVIDIA DGX H100 systems have a combined published maximum system power of 40.8 kW. For an explicitly hypothetical measured average of 7.0 kW per system, their average rack IT load would instead be 28.0 kW. Assuming a 30-day month, PUE of 1.40 and electricity at $0.12/kWh, that average-load example uses 20,160 kWh of IT electricity, corresponds to 28,224 kWh of allocated facility electricity, and produces an illustrative energy charge of $3,386.88. Only the 10.2 kW maximum per system is NVIDIA’s rating; the average, PUE and tariff are assumptions, not reported measurements. [1.2] [4.2] [4.4]
Reproduce these assumptions in the server-energy and electricity-cost calculator: enter 7,000 average watts, four servers, 720 hours, PUE 1.40 and a rate of 0.12 per kWh. For the measurement comparison, see the AI versus ordinary server power guide.
In this article
- 1. Start with the right boundaries—not just a wattage
- 2. Establish the inputs and the calculation method
- 3. Work through the hypothetical average-load month
- 4. Compare the operating illustration with the maximum-rating case
- 5. Use PUE as an energy-allocation assumption, not a rack specification
- 6. What to measure and verify before deployment
1. Start with the right boundaries—not just a wattage
- Maximum rating: NVIDIA lists DGX H100 system power consumption as 10.2 kW maximum. Four systems therefore total 4 × 10.2 = 40.8 kW on a maximum-rating basis. This is not evidence that the rack continuously consumes that much electricity. [1.2]
- Operating energy: Use average electrical input power over the period being estimated, not the maximum rating alone. In this original example, 7.0 kW per system is an explicitly hypothetical meter-derived average: a value we suppose a representative measurement campaign returned, not an actual test result. [1.2] [4.5]
- Facility electricity: Keep IT electricity separate from supporting infrastructure. DOE defines PUE as total annual data-center facility energy divided by annual IT equipment energy. Applying an assumed PUE to the rack’s IT energy produces a facility-energy allocation, not an additional load that the rack outlets themselves must supply. [4.2] [4.4]
The calculation boundary here is four complete DGX H100 systems only. NVIDIA’s 10.2 kW figure is a system specification, so it should not be replaced by GPU-only power or supplemented by separately adding the internal components already covered by the system rating. External switches, storage and other equipment are excluded from the numerical example. If they are part of your rack, include their measured or appropriately rated loads before calling the result the complete rack IT total. This distinction matters because a four-server subtotal and an entire populated rack are not necessarily the same electrical boundary. [1.2] [7.3] [7.4]
2. Establish the inputs and the calculation method
Use five explicit inputs for this example: four systems; 7.0 kW hypothetical average input per system; 720 hours, calculated as 30 days × 24 hours/day; PUE = 1.40; and an assumed flat energy tariff of $0.12/kWh. These are deliberately chosen illustration inputs, except for the separately retained NVIDIA maximum rating. The 7.0 kW average is not an assertion about typical DGX H100 operation, and the tariff is not a utility quote. Using a 30-day month also keeps the duration transparent rather than silently substituting an annual-average month. [1.2] [4.2]
The essential distinction is between power in kW and energy in kWh. Power describes the electrical load; energy accounts for that load over time. For a specified period, calculate IT energy = average IT power × hours. DOE’s PUE definition then gives the relationship facility energy = IT energy × PUE, provided the PUE appropriately represents the energy boundary and period. Finally, under the example’s assumed flat tariff, calculate energy charge = facility energy × price per kWh. These are unit-consistent arithmetic relationships, not workload-performance predictions. [4.2] [4.4]
For a rack with several devices, first sum their average input powers: P_rack,avg = P_1,avg + P_2,avg + … + P_other,avg. When consumption changes during the month, use time-weighted intervals instead: E_IT = Σ(P_interval × hours_interval). A period average is then total measured energy divided by elapsed hours. This preserves the distinction between changing IT loads and a fixed maximum specification. DOE explicitly notes that annual energy measurements capture dynamic IT-load trends, including power management; the same accounting principle explains why a workload-representative average is more useful for an energy forecast than a single instantaneous reading. [1.2] [4.5]
From four DGX H100 systems to a monthly energy budget
Swipe horizontally to explore the map
Read the mind map as an outline
- Maximum-rating boundary
- NVIDIA: 10.2 kW maximum per DGX H100
- Four systems: 40.8 kW maximum subtotal
- Review electrical capacity separately from average energy
- Hypothetical operating boundary
- Assume 7.0 kW average input per system
- Four systems: 28.0 kW average IT power
- External rack equipment excluded
- Monthly IT electricity
- Assume 30 days = 720 hours
- 28.0 kW × 720 h = 20,160 kWh
- Facility allocation
- Assume PUE = 1.40
- 20,160 × 1.40 = 28,224 kWh
- Not a measured monthly PUE or rack outlet load
- Illustrative energy charge
- Assume $0.12 per kWh
- 28,224 × $0.12 = $3,386.88
- Verify actual tariff and billing terms
Read the branches as separate calculation boundaries. NVIDIA supplies the maximum system rating; average input, duration, PUE and tariff must be measured, verified or explicitly assumed. The example’s facility total is an allocation based on PUE, not a rack-outlet measurement. [1.2] [4.2] [4.4]
3. Work through the hypothetical average-load month
First calculate the rack’s average IT power from the hypothetical measured input: 4 systems × 7.0 kW/system = 28.0 kW. Next calculate monthly IT electricity: 28.0 kW × 720 h = 20,160 kWh. This is the electricity attributed to the four systems before adding facility overhead. It assumes that 7.0 kW is the average across the entire modeled month, including whatever workload and idle periods that month contains. It does not mean each server draws exactly 7.0 kW at every instant, nor does it replace the maximum rating for electrical-capacity review. [1.2] [4.5]
Next apply the assumed facility factor: 20,160 kWh × 1.40 = 28,224 kWh. Equivalently, the allocated average facility power is 28.0 kW × 1.40 = 39.2 kW, and 39.2 kW × 720 h = 28,224 kWh. The difference is 28,224 − 20,160 = 8,064 kWh of allocated supporting-infrastructure energy. This is 40% additional energy relative to IT energy, because the assumed multiplier is 1.40. It is not a claim that 40% of the facility total is overhead, and it is not extra power drawn through the four servers’ cords. [4.2] [4.4]
Finally apply the hypothetical tariff: 28,224 kWh × $0.12/kWh = $3,386.88. This is an illustrative facility-energy charge for the rack allocation, not a complete electricity bill or a quoted hosting price. If you want the four systems’ IT-only energy charge under the same assumed rate, the arithmetic is 20,160 × $0.12 = $2,419.20. Choose the correct boundary before quoting a cost: IT-only electricity and PUE-adjusted facility electricity answer different budgeting questions. Whether your actual commercial agreement charges either amount must be checked against its billing terms. [4.2] [4.4]
4. Compare the operating illustration with the maximum-rating case
A useful comparison holds the system count, month length, PUE assumption and tariff assumption constant, while changing only the system-power input. The maximum-rating case uses 4 × 10.2 = 40.8 kW and assumes that load persists for all 720 hours. Its IT electricity is 40.8 × 720 = 29,376 kWh; allocated facility electricity is 29,376 × 1.40 = 41,126.4 kWh; and the illustrative energy charge is 41,126.4 × $0.12 = $4,935.168, rounded to $4,935.17. This is a constant-maximum scenario, not NVIDIA’s forecast of monthly consumption. [1.2] [4.2]
The table keeps rating-based planning separate from hypothetical operating energy. Both columns exclude external rack equipment. Neither column establishes an actual site PUE, utility rate or measured workload average. The comparison is useful because it shows exactly where the energy estimate changes: the hypothetical average is below the published maximum, while every downstream assumption is unchanged. It does not demonstrate that a particular deployment will achieve the lower figure, and the maximum-based monthly calculation should not be mistaken for a substitute for a complete electrical design. [1.2] [1.4] [4.2]
| Quantity | Constant-maximum scenario | Hypothetical average-load scenario | Meaning |
|---|---|---|---|
| Per-system input | 10.2 kW | 7.0 kW | NVIDIA maximum versus explicitly assumed measured average [1.2] |
| Four-system rack IT power | 40.8 kW | 28.0 kW average | Four complete systems; no external rack equipment [1.2] |
| Period | 720 hours | 720 hours | Assumed 30 days × 24 hours/day [4.2] |
| Monthly IT electricity | 29,376 kWh | 20,160 kWh | IT kW × 720 hours [1.2] [4.2] |
| PUE assumption | 1.40 | 1.40 | Illustrative facility-to-IT energy multiplier [4.2] [4.4] |
| Allocated facility power | 57.12 kW | 39.2 kW average | IT power × assumed PUE; not rack outlet demand [1.2] [4.2] |
| Monthly allocated facility electricity | 41,126.4 kWh | 28,224 kWh | IT electricity × 1.40 [1.2] [4.2] |
| Illustrative energy charge | $4,935.17 | $3,386.88 | Facility kWh × assumed $0.12/kWh; not a complete bill [1.2] [4.2] |
5. Use PUE as an energy-allocation assumption, not a rack specification
DOE’s definition is explicitly annual: total annual facility energy divided by total annual IT equipment energy. Its guide also explains that PUE describes supporting-infrastructure efficiency, not the overall efficiency of the computing operation. For this worked month, 1.40 is simply a chosen modeling factor. Multiplying a rack subtotal by site PUE is a proportional allocation of shared facility energy; it does not independently measure the infrastructure serving that rack. That distinction is especially important when presenting the resulting 39.2 kW as a budgeting figure rather than a physical reading at a rack PDU. [4.2] [4.4]
Before replacing the example with a forecast, obtain the facility’s applicable energy data and identify whether its PUE is an annual historical value, a period-specific calculation or a design assumption. DOE notes that annual measurements account for variable free-cooling savings and dynamic IT loads. Consequently, an annual PUE can be a transparent simplifying input for a monthly budget, but it should not be presented as a measured result for that particular month. If matched-period facility and IT energy readings are available, document their boundaries and period rather than mixing unrelated readings into an apparently precise ratio. [4.2] [4.4] [4.5]

6. What to measure and verify before deployment
Measure representative electrical input. Before committing the production deployment, arrange a representative-system test or obtain applicable measurements for the intended configuration and workload. Record energy and elapsed time so the average can be calculated, and record load variation and peaks separately. Include intended busy periods, idle periods and any external rack IT equipment in the accounting boundary. Because NVIDIA documents multiple power supplies with balanced load distribution, capture total system input rather than treating one cord as the complete system. A post-installation rack measurement should then validate the proposed budget; it cannot retroactively establish that the initial hypothetical average was measured. [10.1] [4.5] [7.4]
Verify distribution capacity and redundancy independently of average energy. Give the electrical designer the four-system 40.8 kW maximum subtotal, the complete equipment inventory and the intended power-feed arrangement. Check the available circuit and PDU capacities and the required operating condition when a feed or component is unavailable. NVIDIA specifies N+2 PSU redundancy for the DGX H100 and says the system ships with six qualified locking power cords. Those facts do not establish that a proposed rack’s upstream distribution is sufficient. Likewise, multiplying a power-supply module rating by its count is not a replacement for NVIDIA’s published whole-system maximum. [1.2] [1.3] [2.1] [10.1]
Check cooling, physical fit and the actual billing inputs. NVIDIA specifies each DGX H100 as 8U, air-cooled and up to 130.45 kg. Four therefore occupy 4 × 8U = 32U and total 4 × 130.45 = 521.8 kg in specified system weight, before the cabinet and other equipment. Verify rack and floor loading, available space, airflow and operating temperatures with the site team. Separately obtain the applicable tariff, billing period and commercial treatment of facility overhead. NVIDIA emphasizes that data centers have distinct power, cooling and space constraints; the numerical electricity example alone cannot establish deployment readiness. [1.2] [1.4] [2.2] [4.2]
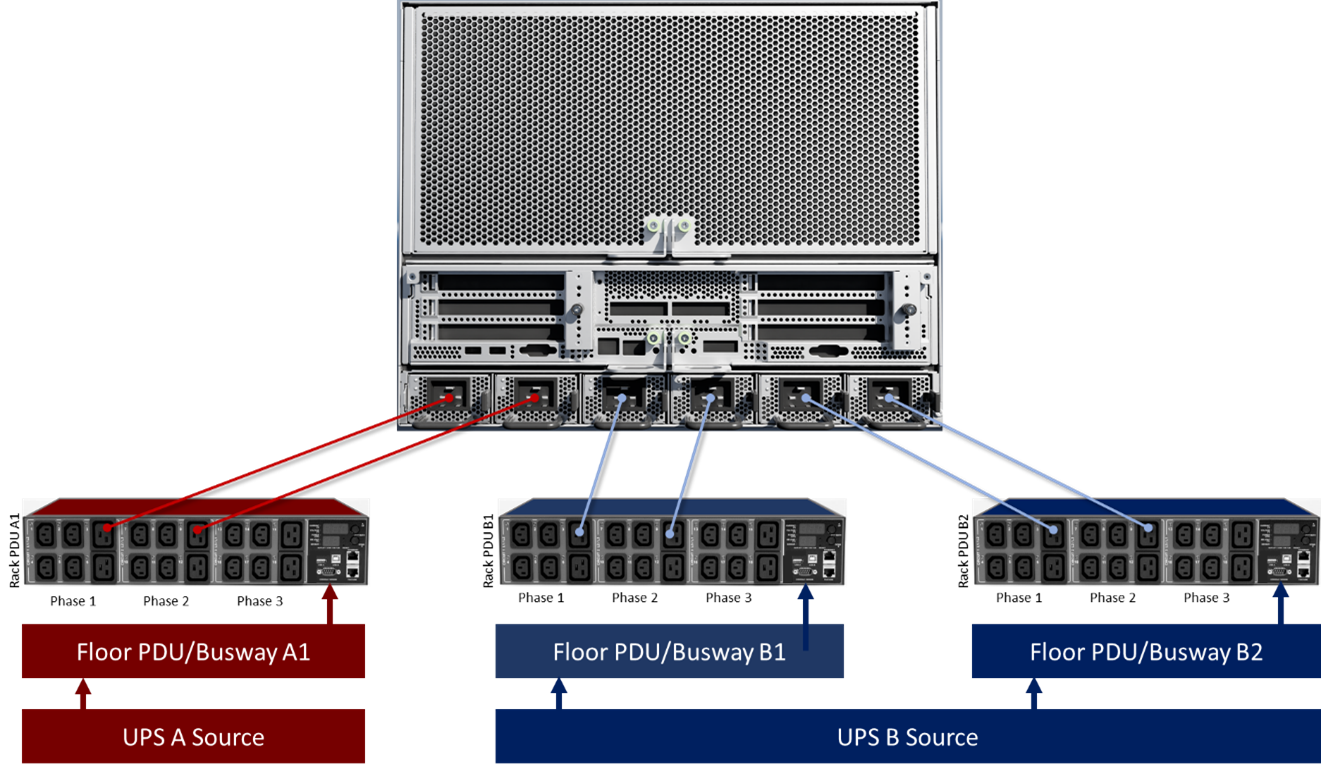 Image unavailable. Open the source below.
Electrical Specifications — NVIDIA DGX SuperPOD: Data Center Design Featuring NVIDIA DGX H100 Systems · docs.nvidia.com
Frequently asked questions
Is the 7.0 kW average an NVIDIA measurement?
No. It is an explicitly hypothetical measured average chosen for this worked example. NVIDIA’s supplied specification establishes 10.2 kW maximum system power, not a workload-specific average. Replace 7.0 kW with representative total-input measurements for your configuration and operating schedule before treating the example as a deployment forecast. [1.2] [4.5]
Should I multiply the number of power supplies by their individual ratings?
Not to estimate the system’s operating consumption. NVIDIA’s user-guide excerpt describes six power supplies with balanced load distribution, while its system specification gives 10.2 kW maximum. PSU module capacity, redundancy and whole-system consumption are different quantities. Use the published system rating for the maximum subtotal and measured total electrical input for an operating-energy estimate. [10.1] [1.2] [1.3]
Does PUE of 1.40 mean the rack needs 40% more outlet capacity?
No. In this calculation, PUE adds a proportional allocation of facility supporting-infrastructure energy to the rack’s IT energy. DOE defines it using facility and IT energy, not rack outlet capacity. The illustrative 28.0 kW IT load and 39.2 kW allocated facility load therefore have different boundaries. Electrical distribution still requires a separate design review. [4.2] [4.4] [1.4]
How should I handle a month when workloads and power vary?
Calculate energy from measured intervals and add the results, or use total metered kWh for the period. Dividing that energy by elapsed hours gives the period’s average kW. Do not assume a busy-period reading represents the entire month. DOE’s discussion of dynamic IT loads supports keeping the measurement period and workload pattern explicit when forming an energy estimate. [4.5]
Which primary references support this calculation?
NVIDIA’s DGX SuperPOD Data Center Design guide supplies the DGX H100’s 10.2 kW maximum system rating and physical specifications. NVIDIA’s DGX H100/H200 documentation supplies power-distribution and cord information. The US Department of Energy’s Best Practices Guide for Energy-Efficient Data Center Design defines PUE and its annual-energy basis. None supplies the hypothetical average, site PUE or tariff used here. [1.2] [2.1] [10.1] [4.2] [4.4]
Conclusion
Keep the calculation in three layers: rack IT power → monthly IT energy → PUE-adjusted facility energy, then apply the applicable energy tariff. Four DGX H100 systems total 40.8 kW on NVIDIA’s maximum-rating basis. Under the separate hypothetical 7.0 kW-per-system average, the worked rack totals 28.0 kW IT and 20,160 kWh over 720 hours. Assumed PUE of 1.40 raises the allocated facility electricity to 28,224 kWh; assumed pricing of $0.12/kWh yields $3,386.88. Replace the illustrative inputs with representative measurements and verified site terms, while retaining a separate maximum-load and infrastructure review. [1.2] [1.4] [4.2] [4.4]
Source notes
No actual workload measurements, site-specific PUE or applicable electricity tariff are supplied. The 7.0 kW average, PUE of 1.40 and $0.12/kWh tariff are explicit illustration assumptions.
The cost example covers only a flat-rate energy charge. Applicable demand charges, fixed charges and other billing terms must be checked separately.
The rack subtotal excludes external networking, storage and other equipment. The example is not a complete electrical, structural or cooling design.
Explore next
References
Open a reference to inspect the original source.
Relevance scores are model estimates of how well each source addresses this question, not probabilities or fact-check ratings. Reasoned guidance is identified on hover.
- 99NVIDIA DGX SuperPOD Data Center Design
docs.nvidia.comPrimary NVIDIA source for the DGX H100 maximum system rating and deployment specifications.The NVIDIA DGX SuperPOD with NVIDIA DGX H100 systems is an optimized system for multi-node DL and HPC. It consists of between 31 and 127 DGX H100 systems (Figure 1), with a total of 1,016 NVIDIA Hopper GPUs.›
- 99Best Practices Guide for Energy-Efficient Data Center Design
www.energy.govPrimary US Department of Energy reference defining PUE, its annual basis and its interpretation.8 Benchmarking Energy efficiency metrics/key performance indicators (KPIs) and benchmarks can be used to track the performance of—and identify potential opportunities to reduce energy use in—data centers.›
- 91Introduction to NVIDIA DGX H100/H200 Systems
- 89NVIDIA DGX H100/H200 User Guide
- 57Empirically-calibrated H100 node power models for accurate AI training energy estimation
iopscience.iop.orgUseful context about node components and IT electricity, but supplied passages contain no applicable measured H100 average.suited to parallel computation hardware. Transformer architecture DNNs benefit from a variety of parallelization techniques including data parallelism, pipeline parallelism (PP), and tensor parallelism (TP) 9 [7], which unlock increased compu tational performance.›
- 43Can Your Racks Support NVIDIA DGX H100 Systems
www.sunbirddcim.comSecondary vendor guidance about monitoring and capacity planning; primary NVIDIA evidence is preferable for specifications.The DGX H100 system's power usage is 10.2 kW maximum. each power supply is 3300 W at 200-240 V, 16A, and 50-60Hz. The DGX H100 has a maximum ...›
- 35Planning a Data Center Deployment
- 25H100 GPU
www.nvidia.comPrimary NVIDIA GPU information, but GPU performance claims do not establish complete rack electricity.Product Specifications ; Max Thermal Design Power (TDP), Up to 700W (configurable), 350-400W (configurable) ; Multi-Instance GPUs, Up to 7 MIGS @ 10GB each, Up to ...›
- 20GPU Power and Cooling Calculator - SLYD
slyd.comThird-party calculator with different product examples and acknowledged sourcing limitations; unnecessary for this calculation.Estimate GPU server, rack, cooling, and facility power. Use this calculator to determine power, cooling, and electrical requirements before procurement. PUE ...›
- 8Nvidia HGX H100 system power consumption : r/HPC
www.reddit.comForum question provides no verified measurement or additional primary support.I am wondering, Nvidia is speccing 10.2KW as the max consumption of the DGX H100, I saw one vendor for an AMD Epyc powered HGX HG100 system ...›
Generated with Ithy Pro. Editorial arithmetic and primary-source checks: 2026-10-23. AI-assisted; this is not a named human expert review. References open the original sources.
Compare the AI responses
Read each model’s complete response below.
 GPT-6 Luna
For four DGX H100 systems, NVIDIA’s published maximum is 10.2 kW per system, or 40.8 kW of rack IT load. For an illustrative—not measured—average of 7.0 kW per system, rack IT load is 28.0 kW. With an explicitly assumed PUE of 1.40, facility draw is 39.2 kW on average; over an assumed 30-day month, that is 28,224 kWh. At an assumed tariff of $0.12/kWh, the illustrative energy charge is $3,386.88. These examples are calculations from stated assumptions, not deployment measurements or a quoted electricity rate.
- NVIDIA’s DGX H100 specification lists 10.2 kW maximum system power. Four systems therefore have a rated maximum rack IT load of 4 × 10.2 = 40.8 kW. This is a maximum-based planning figure, not a claim that the rack continuously draws 40.8 kW. The cited specification is for the DGX H100 system; it does not itself state the measured average for a particular workload. [1.2]
- Worked example assumptions: suppose a hypothetical meter-based average is 7.0 kW per system, the four-system rack is occupied and operating continuously, PUE is assumed to be 1.40, the billing month is treated as 30 days (720 hours), and the electricity tariff is assumed to be $0.12/kWh. The 7.0 kW, PUE, duration, and tariff are illustrative inputs, not NVIDIA measurements, a DOE recommendation, or a reported utility rate.
- Comparison table, with all power figures in kW and monthly energy in kWh: maximum-rated scenario—rack IT power 4 × 10.2 = 40.8; facility power at assumed PUE 1.40 is 40.8 × 1.40 = 57.12; 30-day facility energy is 57.12 × 720 = 41,126.4 kWh. Hypothetical-average scenario—rack IT power 4 × 7.0 = 28.0; facility power is 28.0 × 1.40 = 39.2; monthly facility energy is 39.2 × 720 = 28,224 kWh. The second scenario is not a demonstrated result. In both rows, rack IT power excludes facility overhead; facility power and energy include overhead as represented by the assumed PUE. [1.2] [4.2]
- The calculation separates rack IT load from facility electricity: multiply the sum of IT equipment power by PUE to estimate facility power, then multiply facility kW by hours to obtain kWh. DOE defines PUE as total annual facility energy divided by energy drawn by IT equipment, and notes that PUE is an energy-based metric. Applying a single assumed PUE to a 30-day example is a simplifying illustration, not an annual measured PUE. [4.2] [4.4]
- At the hypothetical tariff, estimated energy charges are 41,126.4 × $0.12 = $4,935.17 for the maximum-rated scenario and 28,224 × $0.12 = $3,386.88 for the hypothetical-average scenario. These are arithmetic illustrations only; they do not establish the applicable tariff or include any other billing components. [1.2] [4.2]
- Before deployment, measure the rack’s actual IT input power over representative workloads and idle periods, and establish the period and method used to calculate an average. Also verify the intended system count and configuration, power distribution and circuit capacity, and the facility’s measured or applicable PUE and utility tariff. DOE recommends energy-efficiency metrics for tracking data-center performance; its PUE definition uses annual energy, so a short monitoring interval should not be presented as an annual PUE without qualification. [1.2] [4.2] [4.4]
The supplied NVIDIA evidence gives a maximum DGX H100 system rating, not a measured average for the proposed workload; actual average power must be measured at deployment.
No site-specific PUE, electricity tariff, billing structure, or measurement period is supplied. The example values for these inputs are explicitly hypothetical.
 Claude Haiku 5.5
NVIDIA's DGX H100 documentation gives a maximum system power consumption of 10.2 kW, and its power specification lists six power supplies with 3300 W per supply at 200-240 V. Rack-level planning can start from the maximum rating, but a measured average, rack IT power, PUE and tariff are separate inputs that the supplied evidence does not provide for a specific deployment. The worked example below is hypothetical: four systems at the 10.2 kW maximum give 40.8 kW of IT load, which, with an assumed PUE and an assumed measured average, can be converted to kWh per month. The sources support the component inputs and the PUE definition, but not a complete calculation method or a specific tariff. Sources cited: NVIDIA DGX SuperPOD design guide, NVIDIA DGX H100/H200 user guide, DOE best-practice guide, and the SLYD calculator (which the sources flag as lacking primary tariff support).
- NVIDIA's DGX SuperPOD design guide lists the DGX H100 system power consumption as 10.2 kW max, with 8 rack units and air cooling. [1.2]
- The NVIDIA DGX H100/H200 user guide states the system contains six power supplies with balanced load distribution, with a rating of 10.2 kW max and 3300 W per power supply at 200-240 V, 16 A, 50-60 Hz. [10.1]
- A worked rack example, with four systems at the rated maximum: 4 × 10.2 kW = 40.8 kW of system-level maximum power. This is an arithmetic illustration from the rated maximum, not a measured draw; the sources do not give a measured average for a DGX H100 running a workload.
- Monthly energy can be estimated as facility kW × hours per day × days per month, with facility kW obtained by multiplying IT kW by PUE. Under an assumed average of 6 kW per system (hypothetical), four systems give 24 kW IT; with PUE 1.5 (assumed), facility power is 36 kW, and 36 kW × 24 h × 30 days = 25,920 kWh per month. Tariff cost would then be kWh × the local rate, which the supplied evidence does not establish.
- PUE is the ratio of total annual facility energy to the energy drawn by IT equipment, and it measures only the supporting infrastructure, not the efficiency of the whole data center. The DOE guide says an average data center has a PUE of 1.6 and that some efficient facilities achieve below 1.1. [4.2] [4.4]
- The DOE guide states PUE is defined using average annual energy (kWh), and that annual measurements capture variable free-cooling savings and dynamic IT load trends, so a monthly estimate from a single nominal PUE is a simplification. [4.4] [4.5]
- DCIM planning guidance from SunbirdDCIM states that rack capacity planning should include power budgeting, cooling/heat load, and weight, and that the DGX H100 has a maximum weight of 287.7 lb (130.45 kg) and a heat output of 38,557 BTU per hour at its recommended operating environment. [8.3] [8.5] [8.6]
- Before deployment, measure or obtain: the actual average and peak draw of each system under the intended workload; the rack's power distribution capacity and per-circuit limits; the facility's measured PUE; the cooling and heat load; and the site's electricity tariff. None of these figures is supplied for a specific site in the evidence.
No supplied source gives a measured average power draw for a DGX H100 running a real workload; the 6 kW average in the example is hypothetical and must be replaced with measurement.
The supplied sources do not include an electricity tariff; the SLYD calculator states its international rates had no primary source, so no rate is used here.
The PUE value of 1.5 in the example is an assumption; the DOE guide only provides general averages (1.6) and efficient-facility examples (below 1.1), so a site-specific value must be measured.
Claude Sonnet 5.5
Rack power is the sum of IT loads; monthly energy is kW × hours; facility energy multiplies IT energy by PUE; cost is kWh × tariff. NVIDIA lists 10.2 kW max per DGX H100, so four systems give 40.8 kW as a nameplate ceiling, not an expected average. A hypothetical 70% average (my assumption) gives 28.56 kW IT; with an assumed PUE of 1.4 and 730 h/month, about 20,849 kWh IT and 29,189 kWh facility. Tariff is a placeholder to be replaced with local rates. Measure actual load before deployment.
- NVIDIA's DGX H100 specification lists system power consumption as 10.2 kW max. This is a maximum rating, so it is the right input for worst-case sizing but not a measured average. [1.2] [10.1]
- Maximum rack IT power for four systems: 4 × 10.2 kW = 40.8 kW, before switches, PDUs or other rack gear (not included here). Over a 730-hour month, 40.8 kW is 29,784 kWh as an upper bound. Because this uses a ceiling, it likely overstates real consumption. [1.2]
- Hypothetical measured average (not an NVIDIA figure): assume each system averages 7.14 kW (70% of max). Rack IT = 4 × 7.14 = 28.56 kW. Monthly IT energy = 28.56 × 730 = 20,849 kWh. The 70% is illustrative only and must be replaced by metered data. [1.2]
- PUE is total facility energy divided by IT equipment energy, measured on an annual energy basis. DOE's guide cites an average of 1.6 and some facilities below 1.1. Hypothetical PUE 1.4: facility energy = 20,849 × 1.4 ≈ 29,189 kWh/month (about 39,977 kWh at the 40.8 kW ceiling... computed as 29,784 × 1.4 = 41,698 kWh). PUE covers supporting infrastructure, not IT efficiency. [4.2] [4.4] [4.5]
- Tariff step: cost = facility kWh × $/kWh. With a placeholder $0.10/kWh (an assumption, not a source value): average case 29,189 × 0.10 ≈ $2,919/month; ceiling case 41,698 × 0.10 ≈ $4,170/month. Use your actual blended rate including demand charges. [6.2]
- Comparison table (rack of 4 DGX H100, 730 h, PUE 1.4, $0.10): Max rating: 40.8 kW IT, 29,784 kWh IT, 41,698 kWh facility, ~$4,170. Hypothetical 70% average: 28.56 kW IT, 20,849 kWh IT, 29,189 kWh facility, ~$2,919. Only the 10.2 kW per system is sourced; the rest are assumptions. [1.2]
- Before deployment, verify: actual power draw under your workloads, PSU input specs (each of six supplies is 3300 W at 200–240 V, 16 A; N+2 redundancy), circuit and PDU capacity, cooling (air-cooled, 38,557 BTU/h heat output per system per one vendor blog), weight (287.6 lb), and operating temperature. NVIDIA says to consult it on data center constraints. [10.1] [1.3] [8.6] [1.2] [1.4]
- Primary references: NVIDIA DGX H100 specs and SuperPOD design guide (with a power table for rack calculation) and the DOE best-practice guide for PUE. Third-party calculators and DCIM blogs are secondary. [3.1] [4.2] [1.2]
The supplied excerpts do not give NVIDIA's measured typical DGX H100 draw, so the average is purely hypothetical.
SuperPOD Table 2 rack power values were not included in the excerpts.
The 1.4 PUE, 70% load and tariff are illustrative, not sourced.