
Crypto Market Forecasting App Development
Develop an insightful tool to predict bull and bear market dynamics in the crypto space
Highlights
- Historical Analysis: Integrate past market cycles and key events like halving, bull runs, and market corrections for precise forecasting.
- AI and Technical Integration: Use AI technologies such as machine learning (LSTM, RNN) alongside technical indicators like moving averages, RSI, and MACD to interpret market sentiments.
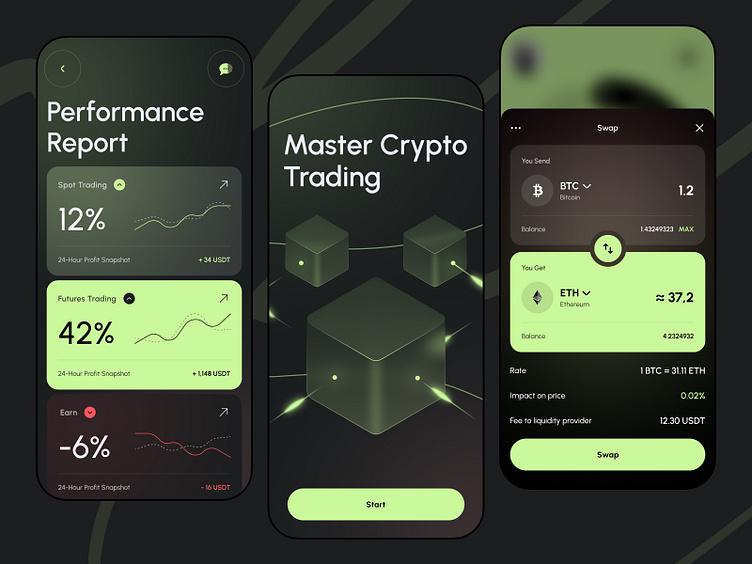
- User-Friendly Experience: Develop an intuitive interface featuring customizable widgets, real-time alerts, and a comprehensive data visualization layout for both short- and long-term forecasts.
Introduction
Forecasting crypto market trends is a challenging yet fascinating endeavor that involves complex modeling, historical data analysis, and real-time market monitoring. The aim is to develop an application that accurately predicts when the market will be bullish or bearish, drawing upon years of market trends, technical signals, and sentiment analysis.
In this detailed guide, we will walk through the key components necessary for creating a crypto forecasting app. We will discuss methods to analyze historical market cycles, identify key technical indicators, design robust AI models, and build an engaging user interface. This comprehensive approach provides the framework for a tool that can help investors and traders make informed decisions based on systematic predictions and data-driven insights.
Historical Analysis of Crypto Market Trends
Understanding the historical trends of the cryptocurrency market is essential to forecasting future movements. The crypto market, notorious for its high volatility, exhibits distinct bull and bear cycles that have shaped the investment landscape.
Key Historical Phases
Bull Markets
Bull markets are defined as long periods where prices surge significantly. For instance, the 2017 bull run saw Bitcoin’s price escalate from around $1,000 to nearly $20,000, fueled by robust market sentiment, increased media coverage, and heightened public interest. In the 2020-2021 cycle, institutional adoption and broader market acceptance played pivotal roles in driving prices from approximately $14,300 to peaks near $91,000. These movements highlight a market fueled by optimism, low-risk aversion, and significant capital inflows.
Bear Markets
In contrast, bear markets are characterized by prolonged downturns where prices fall significantly—often by 20% or more from recent highs. The aftermath of the 2017 peak brought about a notable bear market, as Bitcoin experienced an 83% decline, underscoring the dramatic shifts in market sentiment and investor confidence. Similar trends were observed in 2022, where external factors such as regulatory changes and rising interest rates contributed to price declines.
Seasonal Patterns & Market Catalysts
Besides the conventional bull and bear cycles, market trends often coincide with specific events and seasonal patterns. One notable pattern is Bitcoin halving events, which occur approximately every four years and historically lead to supply shocks that affect price dynamics. In addition, regulatory updates, technological advancements in blockchain, and shifts in global economic conditions can serve as catalysts that intensify market movements.
Core Components of the Crypto Forecasting App
1. Data Collection and Integration
The foundation of any forecasting app is robust data collection. This includes:
- Historical Data: Accumulate years of pricing, volume data, and historical market cycles from reputable sources and cryptocurrency exchanges. This data should cover bull and bear market phases, halving events, and noteworthy market corrections.
- Real-Time Data: Use APIs from exchanges like Binance, Coinbase, or Kraken to fetch current price movements, trading volumes, and other market metrics. Real-time integration ensures predictions stay current.
- Market Sentiment Data: Augment price data with sentiment analysis from social media, financial news, and investor forums to capture market psychology.
Ensuring data reliability and breadth can help reduce prediction noise while providing a more precise analytical framework.
2. Predictive Modeling and AI Integration
Utilizing advanced predictive models is critical for accurate forecasting. The following methodologies can be incorporated:
Machine Learning Algorithms
Incorporate algorithms such as Long Short-Term Memory (LSTM) networks and Recurrent Neural Networks (RNNs) that are particularly effective in time series forecasting. These models can learn patterns from historical price data and predict future trends based on short-term and long-term signals.
# Sample Code to Train an LSTM Model for Crypto Forecast
import pandas as pd
import numpy as np
from sklearn.preprocessing import MinMaxScaler
from keras.models import Sequential
from keras.layers import LSTM, Dense

# Load historical price data
df = pd.read_csv('crypto_data.csv')
prices = df['Close'].values.reshape(-1, 1)

# Normalize data to improve model performance
scaler = MinMaxScaler(feature_range=(0,1))
scaled_prices = scaler.fit_transform(prices)

# Define parameters for training dataset
def create_dataset(data, time_step=100):
    X, y = [], []
    for i in range(len(data)-time_step-1):
        X.append(data[i:(i+time_step), 0])
        y.append(data[i+time_step, 0])
    return np.array(X), np.array(y)

time_step = 100
X, y = create_dataset(scaled_prices, time_step)
X = np.reshape(X, (X.shape[0], X.shape[1], 1))

# Build an LSTM model
model = Sequential()
model.add(LSTM(units=50, return_sequences=True, input_shape=(X.shape[1], 1)))
model.add(LSTM(units=50))
model.add(Dense(25))
model.add(Dense(1))

model.compile(optimizer='adam', loss='mean_squared_error')
model.fit(X, y, epochs=1, batch_size=1)
The above Python snippet illustrates the initial stages of developing an LSTM-based model. For a production application, you would further enhance this model with hyperparameter tuning, multiple layers, and longer training epochs.
Technical and Fundamental Indicators
Integrating technical analysis indicators like Moving Averages, Relative Strength Index (RSI), and Moving Average Convergence Divergence (MACD) is essential. These indicators provide short-term trend insights, while fundamental analysis looks at macroeconomic factors, regulatory developments, and institutional adoption trends.
The fusion of technical, fundamental, and sentiment analysis creates a robust multi-dimensional forecasting model capable of identifying emerging bull or bear markets.
3. User Interface and Experience Design
A user-friendly design is imperative to translating complex predictions into actionable insights. Key elements include:
- Dashboard: A central dashboard that displays real-time market data, price trends, and forecast indicators in a clear and concise manner.
- Customizable Widgets: Allow users to tailor the app interface to focus on specific cryptocurrencies, preferred time ranges for forecasts (daily, weekly, monthly), and even risk tolerance settings.
- Visualization Tools: Implement interactive charts, graphs, and tables to illustrate historical trends, predicted trends, and technical indicator overlays.
- Alerts and Notifications: Integrate real-time alerts for significant market shifts, ensuring that traders and investors can react promptly to changes in market sentiment.
Analyzing Past Trends and Forecasting Future Patterns
A detailed study of past market cycles lays the groundwork for robust forecast algorithms. Analyzing historical data not only helps in understanding the market's behavior but also in identifying recurring patterns and triggers.
Case Studies of Market Cycles
Historical data reveals several notable periods:
- The 2017 Bull Run: Initiated by significant investor interest and media hype, Bitcoin's price skyrocketed, creating a paradigm of market exuberance, which was later followed by a drastic downturn.
- Post-2017 Correction: The ensuing bear market showed that such exuberance can abruptly give way to market corrections, emphasizing the influence of overvaluation and panic selling.
- Institutional Adoption Cycle (2020-2021): The infusion of institutional capital brought about another significant bull market, marked by high trading volumes and advanced technical signal patterns.
- 2022 Bear Market: A period characterized by regulatory tightening, market corrections, and declining investor confidence, reinforcing the cyclical nature of crypto trends.
Data Visualization and Trend Comparison
To better understand the dynamics between bull and bear markets, the following table offers a simplified comparison of key market phases:
| Market Phase | Key Characteristics | Historical Example |
|---|---|---|
| Bull Market |
|
2017 and 2020-2021 cycles |
| Bear Market |
|
Post-2017 correction and 2022 downturn |
Implementing the Forecasting App
Bringing together all the elements discussed, the step-by-step approach to building an effective crypto forecasting app includes the following phases:
Phase 1: Data Infrastructure Setup
Start by establishing a robust data collection system. Build APIs or use third-party integrations to fetch both historical and real-time data. Organize the data into accessible databases for further processing.
Phase 2: Model Development and Training
Develop your predictive models by:
- Implementing AI models like LSTM to capture time-dependent patterns.
- Using technical indicators (RSI, MACD) to create multi-layered predictions.
- Tuning the models with historical market data to improve their predictive accuracy.
Regularly validate and cross-check your models against real market movements to ensure high reliability.
Phase 3: User Interface and Dashboard Design
Design an intuitive dashboard that offers:
- Interactive charts displaying historical and predicted trends.
- Customizable views for different cryptocurrencies and time ranges.
- Integrated alerts for significant market changes.
- A clean and responsive layout adaptable for both desktop and mobile users.
Phase 4: Deployment and Continuous Improvement
Deploy your application on a scalable platform. Once online, collect user feedback and monitor real-time performance adjustments. Continuous improvement is crucial in a fast-paced market; update algorithms and interface elements as market conditions evolve.
Conclusion
The creation of a crypto market forecasting application involves synthesizing vast amounts of historical data, integrating sophisticated AI and technical analytics, and presenting this information through an engaging and user-friendly interface. By studying past bull and bear market cycles, leveraging machine learning for time series prediction, and incorporating technical indicators with sentiment analysis, developers can build a tool that not only predicts future trends but also equips investors with actionable insights.
This comprehensive approach ensures that the app remains relevant as market conditions evolve. The modular design—spanning data collection, robust modeling, interactive visualization, and continuous improvement—provides a strong foundation for a forecasting app capable of handling the inherent volatility of the cryptocurrency market. With careful calibration and real-time monitoring, this tool can serve as a valuable asset for anyone navigating the dynamic realm of crypto trading.
References
- Crypto AI Trend - CryptoAITREND
- CoinCodex Predictions - CoinCodex
- Cryptocurrency Price Predictions - Capex Academy
- Crypto Market Trends 2024 - DXTalks
- Bitcoin Bull and Bear Cycles - KuCoin
Recommended Further Exploration
Last updated February 24, 2025