
Python-Based Cryptocurrency Trading Strategy
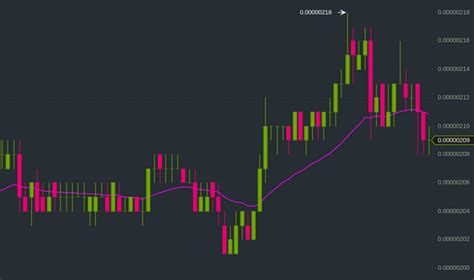
This document outlines a comprehensive cryptocurrency trading strategy designed for high win rates, low drawdowns, and relatively high trading frequency, specifically for BNB, ETH, and SOL, using a maximum of four technical indicators, and operating on a daily (1D) timeframe. The strategy is implemented using Python and various libraries.
Core Strategy Design
The strategy focuses on identifying high-probability trading opportunities while minimizing risk. It combines multiple technical indicators to confirm entry and exit points, aiming for a balance between profitability and risk management.
Trading Assets
The strategy is exclusively designed for trading the following cryptocurrencies:
- Binance Coin (BNB)
- Ethereum (ETH)
- Solana (SOL)
Timeframe
The strategy operates on a daily (1D) timeframe, which provides a balance between capturing trends and filtering out short-term noise.
Objectives
The primary objectives of this strategy are:
- High Win Rate: Prioritize reliable signals to reduce the number of losing trades.
- Low Drawdown: Implement strict risk management, including stop-loss orders, to control potential losses.
- High Trading Frequency: Utilize a combination of indicators and parameters to identify frequent trading opportunities without sacrificing accuracy.
Technical Indicators
The strategy employs a combination of four technical indicators to generate trading signals. These indicators are chosen for their effectiveness in identifying potential entry and exit points.
Moving Averages (MA)
Moving averages are used to identify the overall trend direction. Both short-term and long-term moving averages are used to generate crossover signals.
- Short-term MA: A shorter period MA (e.g., 10 or 20 days) reacts quickly to price changes.
- Long-term MA: A longer period MA (e.g., 50 days) provides a smoother view of the trend.
Relative Strength Index (RSI)
The RSI is a momentum indicator that measures the magnitude of recent price changes to evaluate overbought or oversold conditions.
- Overbought: RSI values above 70 suggest that the asset may be overvalued and prone to a price correction.
- Oversold: RSI values below 30 suggest that the asset may be undervalued and poised for a price increase.
Bollinger Bands
Bollinger Bands consist of a middle band (typically a 20-day moving average) and upper and lower bands, which are standard deviations away from the middle band. They help identify price volatility and potential breakout points.
- Upper Band: Prices approaching the upper band may indicate an overbought condition.
- Lower Band: Prices approaching the lower band may indicate an oversold condition.
Moving Average Convergence Divergence (MACD)
The MACD is a trend-following momentum indicator that shows the relationship between two moving averages of a security’s price. It helps identify trend strength and potential reversals.
- MACD Line: Calculated by subtracting the 26-period Exponential Moving Average (EMA) from the 12-period EMA.
- Signal Line: A 9-period EMA of the MACD line.
- Crossovers: When the MACD line crosses above the signal line, it indicates a potential buy signal; when it crosses below, it indicates a potential sell signal.
Average Directional Index (ADX)
The ADX is used to measure the strength of a trend. It helps to filter out trades when the market is not trending strongly.
- ADX Value: An ADX value above 25 indicates a strong trend.
Trading Logic
The trading logic combines the signals from the technical indicators to generate buy and sell signals.
Buy Signals
A buy signal is generated when the following conditions are met:
- Moving Average Crossover: The short-term MA crosses above the long-term MA, indicating an upward trend.
- RSI Oversold: The RSI is below 30 and starts to rise, indicating a potential recovery from an oversold condition.
- Price near Lower Bollinger Band: The price is near or below the lower Bollinger Band, suggesting a potential price increase.
- MACD Crossover: The MACD line crosses above the signal line, confirming bullish momentum.
- ADX Confirmation: The ADX is above 25, indicating a strong trend.
Sell Signals
A sell signal is generated when the following conditions are met:
- Moving Average Crossover: The short-term MA crosses below the long-term MA, indicating a downward trend.
- RSI Overbought: The RSI is above 70 and starts to decline, indicating a potential pullback from an overbought condition.
- Price near Upper Bollinger Band: The price is near or above the upper Bollinger Band, suggesting a potential price decrease.
- MACD Crossover: The MACD line crosses below the signal line, confirming bearish momentum.
- ADX Confirmation: The ADX is above 25, indicating a strong trend.
Python Implementation
The strategy is implemented using Python and several libraries, including pandas, numpy, ta, yfinance, and freqtrade. Here's a breakdown of the implementation:
Required Libraries
Install the necessary libraries using pip:
pip install pandas numpy matplotlib ta yfinance python-binance freqtrade
Data Acquisition
Historical price data for BNB, ETH, and SOL is obtained using the yfinance library or the Binance API via python-binance.
import yfinance as yf
import pandas as pd
from binance.client import Client

# Using yfinance
symbols = ['BNB-USD', 'ETH-USD', 'SOL-USD']
start_date = '2020-01-01'
end_date = '2023-01-01'
data = {symbol: yf.download(symbol, start=start_date, end=end_date, interval='1d') for symbol in symbols}

# Using python-binance
API_KEY = 'your_api_key'
API_SECRET = 'your_api_secret'
client = Client(API_KEY, API_SECRET)

def get_historical_data(symbol, interval, start_date):
    klines = client.get_historical_klines(symbol, interval, start_date)
    data = pd.DataFrame(klines, columns=['timestamp', 'open', 'high', 'low', 'close', 'volume',
                                         'close_time', 'quote_asset_volume', 'number_of_trades',
                                         'taker_buy_base_asset_volume', 'taker_buy_quote_asset_volume', 'ignore'])
    data['timestamp'] = pd.to_datetime(data['timestamp'], unit='ms')
    data.set_index('timestamp', inplace=True)
    data = data[['open', 'high', 'low', 'close', 'volume']].astype(float)
    return data

symbols = ['BNBUSDT', 'ETHUSDT', 'SOLUSDT']
data = {symbol: get_historical_data(symbol, '1d', '2023-01-01') for symbol in symbols}
Technical Indicator Calculation
The technical indicators are calculated using the pandas_ta or ta library.
import pandas_ta as ta
from ta.momentum import RSIIndicator
from ta.trend import MACD, ADXIndicator
from ta.volatility import BollingerBands

def add_indicators(df):
    # Using pandas_ta
    df['MA'] = ta.sma(df['Close'], length=20)
    df['RSI'] = ta.rsi(df['Close'], length=14)
    df['BB_upper'], df['BB_middle'], df['BB_lower'] = ta.bbands(df['Close'], length=20, std=2)
    df['MACD'] = ta.macd(df['Close'], fast=12, slow=26, signal=9)['MACD_12_26_9']
    df['MACD_signal'] = ta.macd(df['Close'], fast=12, slow=26, signal=9)['MACDs_12_26_9']

    # Using ta
    df['rsi'] = RSIIndicator(close=df['close'], window=14).rsi()
    macd = MACD(close=df['close'], window_slow=26, window_fast=12, window_sign=9)
    df['macd'] = macd.macd()
    df['macd_signal'] = macd.macd_signal()
    bb = BollingerBands(close=df['close'], window=20, window_dev=2)
    df['bb_upper'] = bb.bollinger_hband()
    df['bb_lower'] = bb.bollinger_lband()
    adx = ADXIndicator(high=df['high'], low=df['low'], close=df['close'], window=14)
    df['adx'] = adx.adx()
    return df

for symbol in symbols:
    data[symbol] = add_indicators(data[symbol])
Signal Generation
Buy and sell signals are generated based on the conditions described in the trading logic.
def generate_signals(df):
    df['Buy_Signal'] = (df['Close'] < df['BB_lower']) & (df['RSI'] < 30) & (df['MACD'] > df['MACD_signal']) & (df['adx'] > 25)
    df['Sell_Signal'] = (df['Close'] > df['BB_upper']) & (df['RSI'] > 70) & (df['MACD'] < df['MACD_signal']) & (df['adx'] > 25)

    df['buy_signal'] = (
        (df['rsi'] < 30) &
        (df['macd'] > df['macd_signal']) &
        (df['close'] < df['bb_lower']) &
        (df['adx'] > 25)
    )
    df['sell_signal'] = (
        (df['rsi'] > 70) &
        (df['macd'] < df['macd_signal']) &
        (df['close'] > df['bb_upper']) &
        (df['adx'] > 25)
    )
    return df

for symbol in symbols:
    data[symbol] = generate_signals(data[symbol])
Backtesting
A simple backtesting framework is implemented to evaluate the strategy's performance.
def backtest(df, initial_balance=10000):
    balance = initial_balance
    position = 0
    portfolio = []
    for i in range(1, len(df)):
        if df['Buy_Signal'].iloc[i] and position == 0:
            position = balance / df['Close'].iloc[i]
            balance = 0
            portfolio.append({'Date': df.index[i], 'Action': 'Buy', 'Price': df['Close'].iloc[i], 'Position': position, 'Capital': balance})
        elif df['Sell_Signal'].iloc[i] and position > 0:
            balance = position * df['Close'].iloc[i]
            position = 0
            portfolio.append({'Date': df.index[i], 'Action': 'Sell', 'Price': df['Close'].iloc[i], 'Position': position, 'Capital': balance})
    final_balance = balance + position * df['Close'].iloc[-1]
    return final_balance

results = {symbol: backtest(data[symbol]) for symbol in symbols}
print(results)
Risk Management
Risk management is crucial for any trading strategy. The following measures are implemented:
-
Stop Loss: A stop-loss order is set at a certain percentage below the entry price (e.g., 5%) to limit potential losses.
-
Take Profit: A take-profit order is set at a certain percentage above the entry price (e.g., 5%) to secure profits.
-
Position Sizing: The position size for each trade is determined based on the risk tolerance and available capital.
stop_loss = 0.95
take_profit = 1.05

def backtest_with_risk_management(df, initial_balance=10000):
    balance = initial_balance
    position = 0
    portfolio = []
    for i in range(1, len(df)):
        if df['Buy_Signal'].iloc[i] and position == 0:
            position = balance / df['Close'].iloc[i]
            balance = 0
            buy_price = df['Close'].iloc[i]
            portfolio.append({'Date': df.index[i], 'Action': 'Buy', 'Price': buy_price, 'Position': position, 'Capital': balance})
        elif position > 0:
            current_price = df['Close'].iloc[i]
            if current_price <= buy_price * stop_loss or current_price >= buy_price * take_profit:
                balance = position * current_price
                position = 0
                portfolio.append({'Date': df.index[i], 'Action': 'Sell', 'Price': current_price, 'Position': position, 'Capital': balance})
    final_balance = balance + position * df['Close'].iloc[-1]
    return final_balance

results_with_risk = {symbol: backtest_with_risk_management(data[symbol]) for symbol in symbols}
print(results_with_risk)
Strategy Optimization
The strategy parameters can be optimized using techniques such as grid search or Bayesian optimization to find the best settings for the given market conditions.
from itertools import product

ma_lengths = [10, 20, 50]
rsi_thresholds = [30, 40]
bb_std = [1, 2]

best_params = None
best_final_capital = 0

for ma_length, rsi_threshold, bb_std_value in product(ma_lengths, rsi_thresholds, bb_std):
    for symbol in symbols:
        df = data[symbol]
        df['MA'] = ta.sma(df['Close'], length=ma_length)
        df['RSI'] = ta.rsi(df['Close'], length=14)
        df['BB_upper'], df['BB_middle'], df['BB_lower'] = ta.bbands(df['Close'], length=20, std=bb_std_value)
        df['MACD'] = ta.macd(df['Close'], fast=12, slow=26, signal=9)['MACD_12_26_9']
        df['MACD_signal'] = ta.macd(df['Close'], fast=12, slow=26, signal=9)['MACDs_12_26_9']
        df['Buy_Signal'] = (df['Close'] < df['BB_lower']) & (df['RSI'] < rsi_threshold) & (df['MACD'] > df['MACD_signal'])
        df['Sell_Signal'] = (df['Close'] > df['BB_upper']) & (df['RSI'] > 100 - rsi_threshold) & (df['MACD'] < df['MACD_signal'])
    final_capital = backtest(df)
    if final_capital > best_final_capital:
        best_final_capital = final_capital
        best_params = (ma_length, rsi_threshold, bb_std_value)

print(f"Best Parameters: {best_params}, Best Final Capital: {best_final_capital}")
Visualization
The trading signals can be visualized using matplotlib to analyze the strategy's performance.
import matplotlib.pyplot as plt

def plot_signals(df, symbol):
    plt.figure(figsize=(14, 7))
    plt.plot(df['Close'], label='Close Price', alpha=0.5)
    plt.scatter(df.index[df['Buy_Signal']], df['Close'][df['Buy_Signal']], label='Buy Signal', marker='^', color='green')
    plt.scatter(df.index[df['Sell_Signal']], df['Close'][df['Sell_Signal']], label='Sell Signal', marker='v', color='red')
    plt.title(f'{symbol} Trading Signals')
    plt.legend()
    plt.show()

for symbol in symbols:
    plot_signals(data[symbol], symbol)
Freqtrade Implementation
The strategy can also be implemented using the freqtrade library, which provides a robust framework for backtesting and live trading.
from freqtrade.strategy import IStrategy
import pandas as pd

class CryptoStrategy(IStrategy):
    minimal_roi = {
        "0": 0.05,
        "30": 0.03,
        "60": 0.01
    }
    stoploss = -0.10
    timeframe = '1d'

    def populate_indicators(self, dataframe: pd.DataFrame, metadata: dict) -> pd.DataFrame:
        dataframe['ma_short'] = dataframe['close'].rolling(window=20).mean()
        dataframe['ma_long'] = dataframe['close'].rolling(window=50).mean()
        delta = dataframe['close'].diff(1)
        up_days = delta.copy()
        up_days[delta <= 0] = 0
        down_days = abs(delta.copy())
        down_days[delta > 0] = 0
        RS_up = up_days.ewm(com=13 - 1, adjust=False).mean()
        RS_down = down_days.ewm(com=13 - 1, adjust=False).mean().add(1e-5)
        dataframe['rsi'] = RS_up / RS_down
        dataframe['rsi'] = 100.0 - (100.0 / (1.0 + dataframe['rsi']))
        dataframe['bb_middle'] = dataframe['close'].rolling(window=20).mean()
        dataframe['bb_upper'] = dataframe['bb_middle'] + 2 * dataframe['close'].rolling(window=20).std()
        dataframe['bb_lower'] = dataframe['bb_middle'] - 2 * dataframe['close'].rolling(window=20).std()
        dataframe['macd'] = dataframe['close'].ewm(span=12, adjust=False).mean() - dataframe['close'].ewm(span=26, adjust=False).mean()
        dataframe['signal'] = dataframe['macd'].ewm(span=9, adjust=False).mean()
        return dataframe

    def populate_buy_trend(self, dataframe: pd.DataFrame, metadata: dict) -> pd.DataFrame:
        dataframe.loc[
            (
                (dataframe['ma_short'] > dataframe['ma_long']) &
                (dataframe['rsi'] < 30) &
                (dataframe['close'] > dataframe['bb_upper']) &
                (dataframe['macd'] > dataframe['signal'])
            ),
            'buy'] = 1
        return dataframe

    def populate_sell_trend(self, dataframe: pd.DataFrame, metadata: dict) -> pd.DataFrame:
        dataframe.loc[
            (
                (dataframe['ma_short'] < dataframe['ma_long']) &
                (dataframe['rsi'] > 70) &
                (dataframe['close'] < dataframe['bb_lower']) &
                (dataframe['macd'] < dataframe['signal'])
            ),
            'sell'] = 1
        return dataframe

from freqtrade import Configuration
from freqtrade.backtesting import backtest

config = Configuration({
    'strategy': 'CryptoStrategy',
    'exchange': {
        'name': 'binance',
        'key': 'YOUR_EXCHANGE_KEY',
        'secret': 'YOUR_EXCHANGE_SECRET',
    },
    'pair_whitelist': ['BNB/USDT', 'ETH/USDT', 'SOL/USDT'],
    'stake_currency': 'USDT',
})

backtest(config, strategy=CryptoStrategy, timerange='2022-01-01..2023-01-01', refresh_pairs=False)
Conclusion
This document provides a detailed guide to designing and implementing a cryptocurrency trading strategy using Python. The strategy combines multiple technical indicators, risk management techniques, and backtesting to achieve high win rates, low drawdowns, and relatively high trading frequency. The provided code snippets and explanations should serve as a solid foundation for further development and optimization. Remember to always test your strategies thoroughly and be cautious when trading with real funds.
References
ta Library Documentation
Last updated January 6, 2025