
Unlock Project Success: A Deep Dive into Earned Value Management (EVM)
Your comprehensive guide to understanding and applying Earned Value Analysis for superior project control and outcomes.
Essential Insights into EVM
- Integrated Performance Measurement: EVM uniquely combines project scope, cost, and schedule to provide a holistic view of performance, moving beyond siloed tracking.
- Early Warning System: By calculating variances and performance indices, EVM acts as an early detector for potential problems, allowing for proactive interventions.
- Data-Driven Forecasting: EVM provides quantitative metrics to forecast project completion costs and timelines with greater accuracy, enabling informed decision-making.
Understanding Earned Value Management (EVM)
What Exactly is EVM?
Earned Value Management (EVM) is a systematic project management methodology used to measure and communicate the real physical progress of a project, integrating its scope, schedule, and cost. It provides an objective assessment of how much work has been completed, compares it against the plan, and tracks the actual costs incurred. In simple terms, EVM helps project managers answer critical questions like: "Are we on schedule?", "Are we within budget?", and "How efficiently are we using our resources?"
The Critical Role of EVM in Project Success
The importance of EVM in modern project management cannot be overstated. It offers several key advantages:
- Objective Performance Tracking: EVM provides quantifiable and objective measures of project performance, reducing reliance on subjective assessments.
- Proactive Problem Identification: It serves as an early warning system, highlighting deviations from the plan (cost overruns or schedule delays) much sooner than traditional methods. This allows project managers to take corrective actions before issues escalate.
- Accurate Forecasting: EVM enables more reliable predictions of a project's final cost and completion date based on current performance trends.
- Improved Stakeholder Communication: It offers a standardized framework and common language for reporting project status to stakeholders, enhancing transparency and accountability.
- Enhanced Decision-Making: By providing data-driven insights, EVM empowers project managers to make more informed decisions regarding resource allocation, risk mitigation, and scope adjustments.
Leading organizations, including government agencies and large corporations, utilize EVM to manage complex projects, underscoring its effectiveness in improving project outcomes and ensuring resources are used efficiently.
Core Components: Key EVM Terms and Formulas
To effectively implement EVM, a clear understanding of its fundamental terms and formulas is essential. These metrics work together to paint a comprehensive picture of project health.
Planned Value (PV)
Planned Value is the authorized budget assigned to the work scheduled to be accomplished by a specific date. It's essentially the baseline budget for work planned up to a certain point in the project timeline. It's also known as Budgeted Cost of Work Scheduled (BCWS).
Formula: PV = Budgeted Cost of Work Scheduled
Earned Value (EV)
Earned Value is the measure of work performed expressed in terms of the budget authorized for that work. It represents the value of the work actually completed to date, based on the original budget. It's also known as Budgeted Cost of Work Performed (BCWP).
Formula: EV = Budget At Completion (BAC) × Actual % Complete
Alternatively, for a specific task: EV = Budgeted cost for the task × % complete for that task
Actual Cost (AC)
Actual Cost is the total cost actually incurred and recorded in accomplishing the work performed during a given time period. It's the real amount of money spent to complete the work. It's also known as Actual Cost of Work Performed (ACWP).
Formula: AC = Actual Cost of Work Performed
Cost Variance (CV)
Cost Variance measures the difference between the earned value (what you got) and the actual cost (what you paid). A positive CV indicates the project is under budget, while a negative CV signifies it's over budget.
Formula: \[ \text{CV} = \text{EV} - \text{AC} \]
Schedule Variance (SV)
Schedule Variance measures the difference between the earned value (the value of work done) and the planned value (the value of work planned). A positive SV means the project is ahead of schedule, while a negative SV indicates it's behind schedule.
Formula: \[ \text{SV} = \text{EV} - \text{PV} \]
Cost Performance Index (CPI)
The Cost Performance Index is a measure of the cost efficiency of budgeted resources. A CPI greater than 1 indicates better than expected cost performance (under budget), while a CPI less than 1 indicates worse than expected cost performance (over budget).
Formula: \[ \text{CPI} = \frac{\text{EV}}{\text{AC}} \]
Schedule Performance Index (SPI)
The Schedule Performance Index is a measure of schedule efficiency. An SPI greater than 1 indicates that more work was completed than planned (ahead of schedule), while an SPI less than 1 indicates less work was completed than planned (behind schedule).
Formula: \[ \text{SPI} = \frac{\text{EV}}{\text{PV}} \]
Estimate At Completion (EAC)
Estimate At Completion is the expected total cost of completing all work. There are several ways to calculate EAC, depending on the assumptions made about future project performance. A common formula assumes that the cost performance to date will continue for the remainder of the project.
Formula (assuming current CPI continues): \[ \text{EAC} = \frac{\text{BAC}}{\text{CPI}} \]
Where BAC is the Budget at Completion (the total planned budget for the project).
EVM in Action: A Small Project Example
Let's illustrate these concepts with a simplified example. Consider a software development project with the following details:
- Total Project Budget (BAC): $200,000
- Planned Project Duration: 10 months
- Reporting Point: End of Month 4
At the end of Month 4:
- Planned Work Completion: 40% of the total project scope was scheduled to be completed.
- Actual Work Completion: 35% of the total project scope has actually been completed.
- Actual Cost Incurred: $75,000 has been spent.
Calculating EVM Metrics:
-
Planned Value (PV):
PV = BAC × Planned % Complete = $200,000 × 40% = $80,000
This means that by the end of month 4, work valued at $80,000 was planned to be completed.
-
Earned Value (EV):
EV = BAC × Actual % Complete = $200,000 × 35% = $70,000
This indicates that work valued at $70,000 has actually been accomplished.
-
Actual Cost (AC):
AC = $75,000 (Given)
This is the total amount of money spent so far.
-
Cost Variance (CV):
CV = EV - AC = $70,000 - $75,000 = -$5,000
The negative value indicates the project is $5,000 over budget.
-
Schedule Variance (SV):
SV = EV - PV = $70,000 - $80,000 = -$10,000
The negative value signifies the project is behind schedule, with the value of work completed being $10,000 less than planned.
-
Cost Performance Index (CPI):
CPI = EV / AC = $70,000 / $75,000 ≈ 0.933
Since CPI is less than 1, it means for every dollar spent, only $0.933 worth of work is being earned. The project is cost-inefficient.
-
Schedule Performance Index (SPI):
SPI = EV / PV = $70,000 / $80,000 = 0.875
Since SPI is less than 1, it means the project is progressing at only 87.5% of the planned rate. It is behind schedule.
-
Estimate At Completion (EAC):
EAC = BAC / CPI = $200,000 / 0.933 ≈ $214,362
This forecast suggests that if the current cost performance continues, the project will likely cost $214,362, which is $14,362 over the original budget.
This example demonstrates how EVM metrics provide clear, quantitative insights into project status, highlighting areas of concern (over budget and behind schedule) and forecasting future outcomes.
Real-World Applications of EVM
EVM is not just a theoretical concept; it's a practical tool used across various industries for effective project management. Its primary applications revolve around:
Tracking Project Performance
EVM allows for continuous monitoring of a project's health by comparing planned progress and budget against actual achievements and expenditures. Project managers regularly update PV, EV, and AC values to track performance against the baseline. This ongoing tracking helps in identifying deviations as soon as they occur.
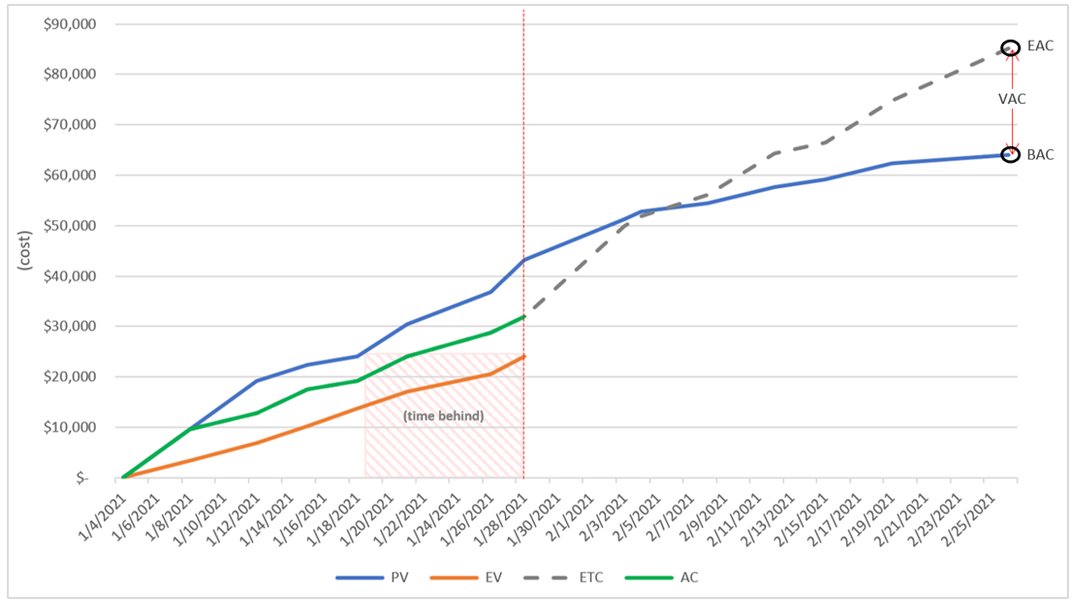
An illustrative graph showing Planned Value (PV), Earned Value (EV), and Actual Cost (AC) plotted over time, visually representing project performance trends.
Forecasting Future Outcomes
Performance indices like CPI and SPI are powerful forecasting tools. By analyzing these trends, project managers can predict:
- The likely final cost of the project (EAC).
- The estimated completion date.
- Potential for future cost overruns or schedule slippages if current trends continue.
Controlling Cost and Schedule
When EVM analysis reveals negative variances (e.g., CV < 0 or SV < 0) or unfavorable performance indices (e.g., CPI < 1 or SPI < 1), it signals the need for corrective actions. Project managers can use this information to:
- Investigate the root causes of the deviations.
- Implement strategies to bring the project back on track (e.g., reallocating resources, adjusting scope, improving process efficiency).
- Revise project plans and forecasts based on realistic performance data.
Key Characteristics of Earned Value Management
EVM possesses distinct characteristics that make it a robust project management technique:
Integration of Scope, Cost, and Schedule
One of the most significant strengths of EVM is its ability to integrate the three primary constraints of any project: scope, cost, and schedule. It requires defining the project scope (Work Breakdown Structure), allocating budgets to work packages (cost baseline), and scheduling these packages over time (schedule baseline). Performance is then measured by assessing how much of the planned scope has been completed within the allocated budget and timeframe.
Early Warning Capability
EVM provides leading indicators of project trouble. Traditional methods might only reveal a cost overrun when invoices exceed the budget, or a schedule delay when a deadline is missed. EVM, through metrics like CV, SV, CPI, and SPI, can flag potential problems much earlier. For example, a declining CPI might indicate cost inefficiencies long before the project is officially over budget, allowing management to intervene proactively.
Objective Measurement
EVM relies on quantitative data and established formulas, providing an objective basis for assessing project performance. This minimizes subjectivity and personal bias in reporting progress, leading to more credible and reliable status updates.
Visualizing EVM: Enhancing Understanding
Visual aids can significantly demystify EVM concepts and make performance data more accessible. Here are some suggestions for effective infographics and visualizations:
1. PV, EV, and AC Trend Graphs
As shown earlier, plotting Planned Value (PV), Earned Value (EV), and Actual Cost (AC) on a line graph against time is a classic EVM visualization. The relative positions and slopes of these lines instantly reveal:
- If EV is below PV, the project is behind schedule.
- If EV is below AC, the project is over budget.
- The gaps between these lines represent the Schedule Variance (SV) and Cost Variance (CV) respectively.
2. Formula Quick Reference Chart
A concise chart or graphic summarizing the key EVM formulas (PV, EV, AC, CV, SV, CPI, SPI, EAC) with brief explanations can serve as a handy reference for project teams and stakeholders. This aids in quick calculations and understanding of the metrics.
3. Performance Zones (Traffic Light System)
A dashboard or matrix that uses color-coding (e.g., green, yellow, red) to represent project status based on CPI and SPI values can provide an at-a-glance overview of project health. For example:
- Green Zone: CPI > 1 and SPI > 1 (On track or better)
- Yellow Zone: CPI or SPI slightly below 1 (Caution, needs monitoring)
- Red Zone: CPI or SPI significantly below 1 (Problematic, requires immediate action)
The following table provides a simple interpretation guide for CPI and SPI values:
| Index | Value | Interpretation | Status Indicator |
|---|---|---|---|
| Cost Performance Index (CPI) | > 1.0 | Under budget (Favorable - getting more value for money spent) | Good |
| Cost Performance Index (CPI) | = 1.0 | On budget (As planned) | Good |
| Cost Performance Index (CPI) | < 1.0 | Over budget (Unfavorable - getting less value for money spent) | Poor |
| Schedule Performance Index (SPI) | > 1.0 | Ahead of schedule (Favorable - work progressing faster than planned) | Good |
| Schedule Performance Index (SPI) | = 1.0 | On schedule (As planned) | Good |
| Schedule Performance Index (SPI) | < 1.0 | Behind schedule (Unfavorable - work progressing slower than planned) | Poor |
This table helps in quickly assessing project efficiency from both cost and schedule perspectives.
Conceptualizing EVM: A Mindmap Overview
To better grasp the interconnectedness of Earned Value Management concepts, the following mindmap provides a visual summary. It outlines the core elements, metrics, applications, and considerations within the EVM framework.
Budgeted Cost of Work Scheduled"] id1b["Earned Value (EV)
Budgeted Cost of Work Performed"] id1c["Actual Cost (AC)
Actual Cost of Work Performed"] id1d["Budget at Completion (BAC)
Total Project Budget"] id2["Performance Metrics"] id2a["Variances"] id2a1["Cost Variance (CV = EV - AC)"] id2a2["Schedule Variance (SV = EV - PV)"] id2b["Indices"] id2b1["Cost Performance Index (CPI = EV / AC)"] id2b2["Schedule Performance Index (SPI = EV / PV)"] id3["Forecasting"] id3a["Estimate at Completion (EAC)"] id3a1["EAC = BAC / CPI"] id3a2["Other EAC Formulas (e.g., considering SPI)"] id3b["Estimate to Complete (ETC)"] id3c["Variance at Completion (VAC)"] id4["Key Applications"] id4a["Performance Tracking"] id4b["Cost Control"] id4c["Schedule Control"] id4d["Stakeholder Reporting"] id5["Benefits"] id5a["Objective Measurement"] id5b["Early Warning System"] id5c["Improved Forecasting"] id5d["Data-Driven Decisions"] id5e["Enhanced Communication"] id6["Challenges"] id6a["Implementation Complexity"] id6b["Data Accuracy Requirement"] id6c["Initial Setup Effort"] id6d["Requires Training & Buy-in"]
This mindmap illustrates how EVM integrates various components to provide a robust framework for project performance management.
Comparing Project Scenarios with EVM Radar Chart
The radar chart below visualizes hypothetical performance characteristics of three different projects across key EVM-related dimensions. This allows for a comparative assessment of their strengths and weaknesses. The dimensions are scored subjectively (e.g., on a scale where higher is better) to illustrate how EVM principles manifest in overall project health. Note that these are illustrative values for demonstration.
In this chart, 'Project Alpha' represents a well-performing project, excelling in most areas. 'Project Beta' shows a project facing common hurdles, with moderate performance. 'Project Gamma' illustrates a project with significant issues across multiple dimensions. Such visualizations can help stakeholders quickly grasp comparative project health based on EVM principles and other performance indicators.
Benefits and Challenges of Implementing EVM
While EVM offers significant advantages, it's also important to acknowledge the potential challenges associated with its implementation.
Benefits of EVM
- Data-Driven Control: EVM provides objective, quantitative data that supports informed decision-making and precise project control, moving beyond gut feelings or anecdotal evidence.
- Improved Visibility and Transparency: It offers clear and consistent insights into project performance for all stakeholders, fostering a shared understanding of project status, progress, and potential issues.
- Early Problem Identification: As highlighted, EVM's variance analysis and performance indices act as an early warning system, enabling proactive management and mitigation of risks before they become critical.
- Enhanced Forecasting Accuracy: Metrics like EAC provide more reliable forecasts of project completion costs and timelines, helping manage expectations and plan future resource needs.
- Improved Communication and Accountability: EVM establishes a common language and framework for discussing project performance, which enhances communication among team members and stakeholders and promotes accountability.
- Integration of Project Elements: It uniquely integrates scope, schedule, and cost, providing a holistic view of project health that is often missed by other tracking methods.
Challenges of EVM
- Complexity of Implementation: Setting up an EVM system requires a well-defined Work Breakdown Structure (WBS), a detailed project schedule, and an integrated cost-accounting system. This can be complex and time-consuming, especially for organizations new to EVM.
- Data Accuracy and Timeliness: The effectiveness of EVM heavily relies on accurate and timely data collection for PV, EV, and AC. Inaccurate or delayed data can lead to misleading performance indicators and flawed decisions.
- Initial Setup Effort and Cost: Establishing the performance measurement baseline (integrating scope, schedule, and budget) and implementing the necessary tracking systems and software can require significant upfront investment in time and resources.
- Resistance to Change and Training Needs: Adopting EVM may require a cultural shift in how projects are managed and progress is reported. Team members and managers may need training and time to adapt to the rigor and transparency of EVM.
- Potential for Misinterpretation: While EVM provides powerful data, the metrics can be misinterpreted if not fully understood. For instance, a positive Schedule Variance (SV) indicates being ahead in terms of value, but not necessarily that critical path activities are ahead.
- Scalability for Small Projects: While EVM is highly beneficial for large, complex projects, its full implementation might be perceived as overly burdensome for very small or simple projects. However, principles of EVM can be scaled down.
This video, "What is Earned Value Management - EVM? PM in Under 5," offers a concise introduction to the fundamental concepts of EVM, making it a great starting point for understanding its core principles and terminology. It quickly covers the basics, aligning well with the foundational knowledge required for project managers, students, and professionals looking to grasp EVM essentials.
Frequently Asked Questions (FAQ) about EVM
What is the primary goal of Earned Value Management?
The primary goal of EVM is to provide an objective measure of project performance and progress by integrating scope, schedule, and cost. It aims to identify variances from the plan early, forecast future performance, and enable project managers to take timely corrective actions to keep the project on track.
How does EVM differ from traditional project tracking methods?
Traditional methods often track cost and schedule independently. For example, they might show that 50% of the budget has been spent and 50% of the time has passed, but not necessarily how much work has been accomplished for that expenditure. EVM integrates these elements. It compares the budgeted cost of work scheduled (PV) with the budgeted cost of work performed (EV) and the actual cost of work performed (AC), providing a more comprehensive view of performance and efficiency.
Is EVM only suitable for large, complex projects?
While EVM is most extensively used and provides the greatest benefits on large, complex projects (like those in defense, aerospace, and major construction), its principles can be scaled and adapted for smaller projects. The level of detail and formality can be adjusted to suit the project's size and complexity. Even a simplified EVM approach can provide valuable insights for smaller endeavors.
What are the first steps to implement EVM on a project?
The initial steps include:
- Define the Scope: Create a detailed Work Breakdown Structure (WBS) that breaks the project into manageable work packages.
- Develop a Schedule: Sequence the work packages and establish a timeline for their completion.
- Allocate Budgets: Assign budgets to each work package in the WBS. This forms the Performance Measurement Baseline (PMB), which represents the Planned Value (PV) over time.
- Establish Progress Measurement Methods: Determine how progress (Earned Value) will be measured for each work package (e.g., 0/100 rule, milestones, percentage complete).
- Implement a System for Tracking Actual Costs (AC): Ensure there's a way to collect and record actual costs accurately and in a timely manner.
Recommended Further Exploration
To deepen your understanding of Earned Value Management and related project control techniques, consider exploring these topics:
- What are some advanced Earned Value Management techniques applicable to highly complex projects?
- How can Earned Value Management be effectively integrated with Agile project management methodologies?
- Which software tools are most effective for implementing and managing Earned Value Management systems?
- Can you provide case studies that demonstrate successful EVM implementation and its impact on project outcomes?
References

Last updated May 7, 2025