
Optimizing Gene Expression Analysis in Pseudomonas aeruginosa Biofilm Formation and Antibiotic Resistance
A Comprehensive Approach to Categorizing and Comparing Gene Expression Data
Key Takeaways
- Strategic Categorization Enhances Data Interpretation: Grouping genes based on their functional roles facilitates a deeper understanding of their contributions to biofilm formation and antibiotic resistance.
- Comprehensive Comparative Analysis Reveals Insights: Comparing gene expression within and across categories highlights regulatory mechanisms and interactions critical for Pseudomonas aeruginosa's adaptability.
- Advanced Bioinformatics Tools are Essential: Utilizing statistical and bioinformatics tools like PCA and heatmaps is crucial for visualizing complex gene expression patterns and identifying significant trends.
Introduction
Pseudomonas aeruginosa is a versatile pathogen renowned for its ability to form biofilms and exhibit antibiotic resistance, posing significant challenges in clinical settings. Understanding the gene expression profiles associated with various stages of biofilm formation and antibiotic resistance is pivotal for developing effective treatment strategies. This comprehensive guide explores the benefits and methodologies of categorizing and comparing gene expression data, supported by insights from recent studies.
Why Grouping Genes is Essential
Functional Organization Facilitates Clarity
Grouping genes into functional categories such as biofilm formation, virulence factors, quorum sensing, and antibiotic resistance allows researchers to streamline data analysis. This organization clarifies each gene's role, enabling a more targeted approach to studying complex biological processes.
Enhanced Comparative Analysis
By categorizing genes, comparisons become more meaningful. Researchers can identify patterns and correlations within specific functional groups and across different categories, revealing how various biological systems interact and influence each other during biofilm development and antibiotic resistance.
Pathway and Mechanism Identification
Functional categorization aids in identifying upregulated or downregulated pathways under specific conditions. Understanding these pathways is crucial for elucidating the mechanisms Pseudomonas aeruginosa employs to adapt and survive in hostile environments, including during antibiotic treatment.
Proposed Functional Categories
1. Biofilm Formation and Regulation
- Alginate Biosynthesis and Regulation: Alg44, algR
- Pel and Psl Polysaccharides: pelA, pslA, PslG
- Biofilm Regulators: bdlA, brlR, BifA, WspA
- Cyclic-di-GMP Signaling: fimX, ndvB
2. Quorum Sensing Systems
- Las System: lasB, lasR
- Rhl System: rhlI, rhlR
- PQS System: mvfR, pqsH
- Quorum Sensing Regulators: qteE, RsmA, gacA
3. Virulence Factors
- Type III Secretion System (T3SS): exoS, exoT, exoU, exsA, pcrV
- Other Virulence Factors: toxA, aprA, plcH
- Siderophores: pvdL, pvdS
- Phenazines: phzA1, phzM
4. Surface Appendages
- Pili: pilB, FimW
- Flagella: fliC
- Fimbriae: cupA
5. Membrane Components
- Outer Membrane Proteins: oprF, oprL, oprM, oprD
6. Antibiotic Resistance
-
Beta-Lactamases: ampC, VIM, blaIMP, blaOXA50, blaPER, blaVEB, blaNDM, dacB
-
Efflux Pumps: emrE, mexB, mexD, mexF, MexR, mexY, mexZ
7. Other/Miscellaneous Functions
- Iron Regulation: fur
- Metabolic Functions: narG
- Stress Response: HtpB
- Signal Transduction: nicD, ppyR, PmtA
- Transport: pstS
Methodologies for Comparative Analysis
Statistical and Bioinformatics Tools
Employing robust statistical and bioinformatics tools is essential for analyzing gene expression data. The following tools are recommended:
Principal Component Analysis (PCA)
PCA reduces data dimensionality, highlighting the most significant patterns in gene expression. It helps identify clusters of co-expressed genes and potential outliers in your dataset.
Heatmaps
Heatmaps provide a visual representation of gene expression levels across different conditions. They facilitate the identification of gene clusters with similar expression profiles, aiding in the recognition of functional relationships.
Gene Ontology (GO) Enrichment Analysis
GO enrichment identifies overrepresented biological processes or pathways within your gene categories. This analysis sheds light on the biological significance of your findings and highlights essential pathways involved in biofilm formation and antibiotic resistance.
Comparative Strategies
Once genes are categorized, several comparative strategies can be employed:
Within-Group Comparisons
Analyze gene expression trends within each functional category under different experimental conditions. For instance, assess how biofilm formation genes vary between sessile and planktonic states.
Across-Group Comparisons
Examine relationships between different functional categories, such as the interplay between quorum sensing systems and antibiotic resistance mechanisms. This approach can reveal regulatory networks and potential targets for therapeutic intervention.
Temporal and Spatial Dynamics
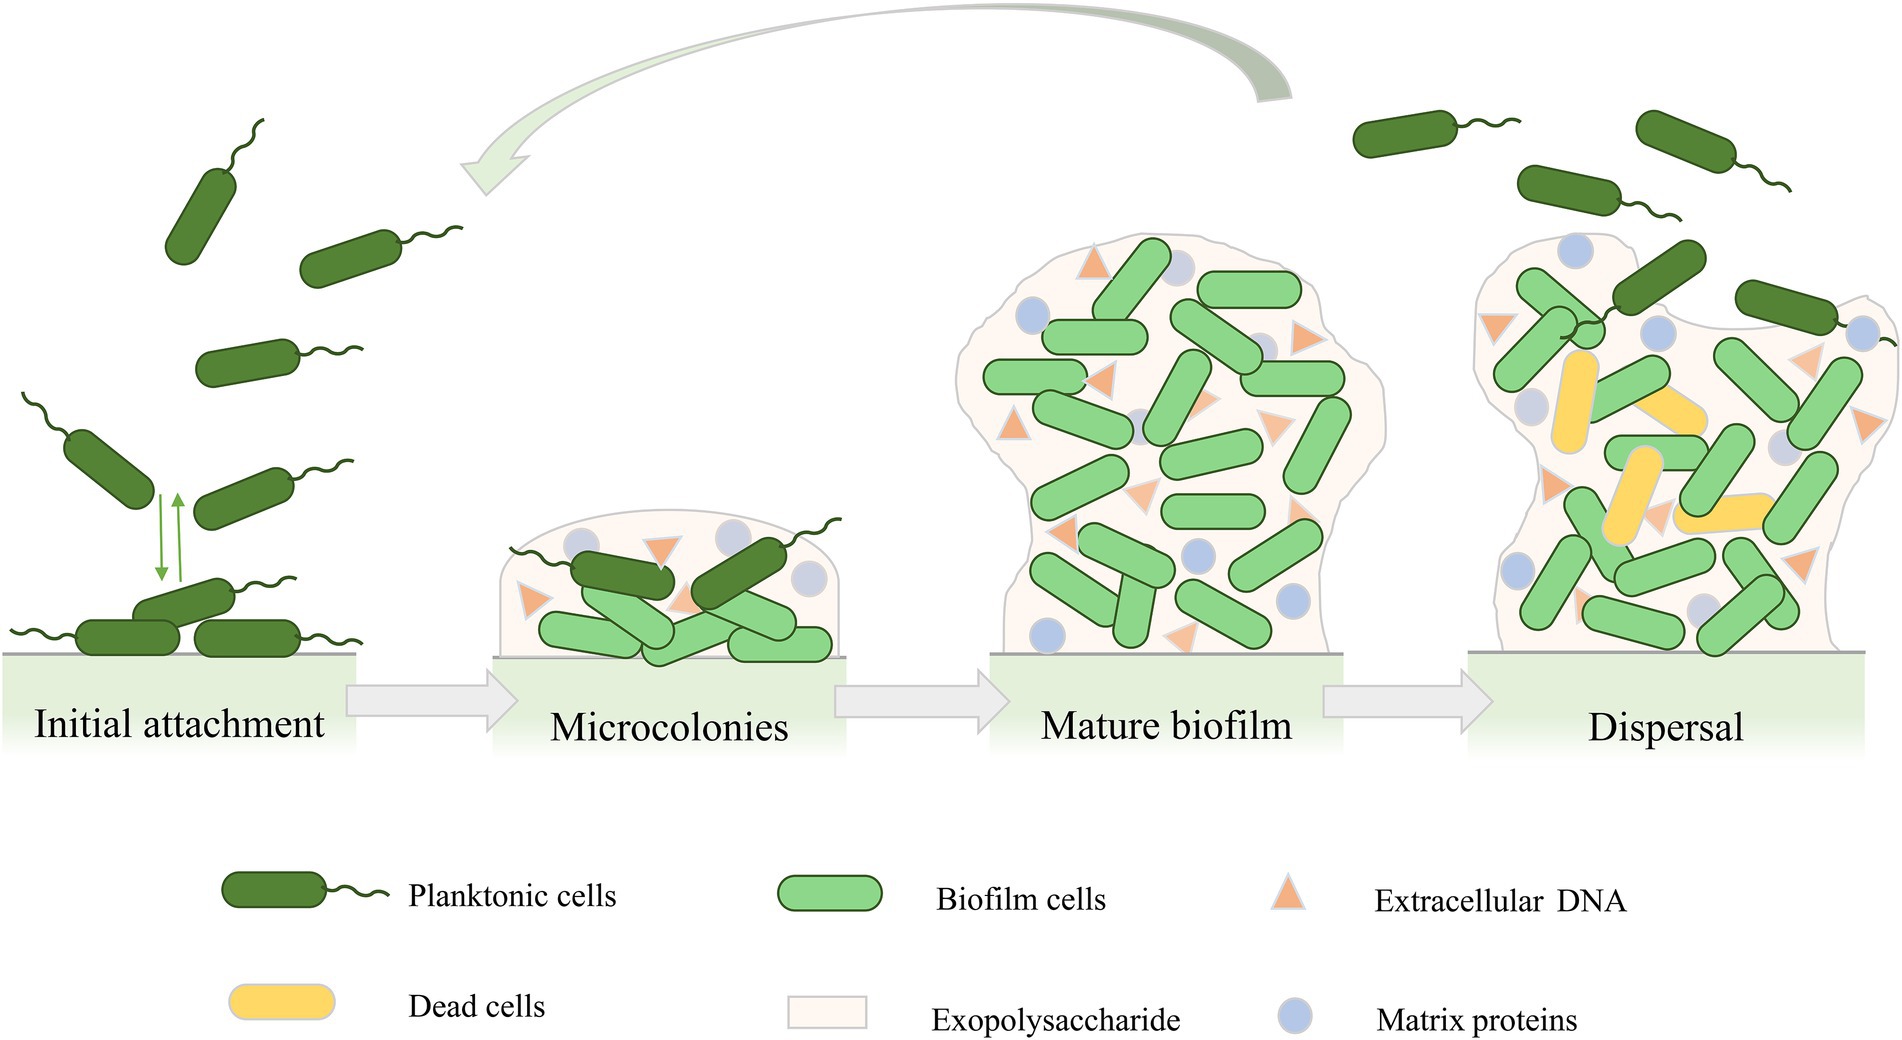
Investigate how gene expression changes during various stages of biofilm development, including initiation, maturation, and dispersal. Understanding these dynamics is crucial for pinpointing critical moments when interventions might be most effective.
Integration with Phenotypic Data
Correlating gene expression data with phenotypic outcomes such as biofilm density, structural integrity, and antibiotic susceptibility provides a holistic view of the organism's behavior. This integration enhances the interpretation of how specific genes contribute to observable traits.
Implementing the Categorization in Your Experiment
Step 1: Validate Gene Functions
Ensure that each gene is accurately categorized based on its known or predicted function. Cross-referencing with reputable databases and literature is advisable to confirm classifications.
Step 2: Data Normalization
Normalize your gene expression data to account for variations in sample preparation and sequencing depth. Techniques such as TPM (Transcripts Per Million) or RPKM (Reads Per Kilobase Million) can be employed for this purpose.
Step 3: Perform Statistical Analysis
Apply statistical tests to determine the significance of expression changes within and across categories. Tools like DESeq2 or edgeR are effective for differential expression analysis.
Step 4: Visualize the Data
Create visual representations of your findings using heatmaps, PCA plots, and network diagrams. Visualization aids in the intuitive understanding of complex data patterns and relationships.
Step 5: Interpret the Results
Analyze the results in the context of existing biological knowledge. Identify potential regulatory mechanisms, co-expression networks, and pathways that are significantly impacted during biofilm formation and antibiotic resistance.
Challenges and Considerations
Data Complexity
Gene expression data can be highly complex, with numerous interactions and regulatory layers. Careful planning and methodical analysis are required to tease apart these complexities effectively.
Variability in Experimental Conditions
Ensure consistency in experimental conditions to minimize variability. Factors such as nutrient availability, temperature, and incubation time can significantly impact gene expression profiles.
Interpretation of Results
Correlation does not imply causation. While gene expression changes can suggest potential regulatory mechanisms, further experimental validation is necessary to confirm these hypotheses.
Conclusion
Grouping genes into functional categories and performing comparative analysis is a highly effective strategy for understanding the intricate processes involved in biofilm formation and antibiotic resistance in Pseudomonas aeruginosa. This structured approach not only enhances data interpretation but also facilitates the identification of key regulatory mechanisms and potential therapeutic targets. By leveraging advanced bioinformatics tools and integrating phenotypic data, researchers can gain comprehensive insights into the organism's adaptability and resilience, ultimately contributing to the development of more effective treatment strategies.
References
Comparative transcriptome analyses of Pseudomonas aeruginosa
Gene expression in Pseudomonas aeruginosa swarming motility
RNA-Seq reveals that Pseudomonas aeruginosa mounts growth ...
BACTOME—a reference database to explore the sequence- and ...
Identification of Genes Involved in Pseudomonas aeruginosa Biofilm ...
Compendium-Wide Analysis of Pseudomonas aeruginosa Core and Accessory Genes
Intrinsic and Extrinsic Regulation of Type III Secretion Gene Expression
Localized Gene Expression in Pseudomonas aeruginosa Biofilms
Gene Expression Profiling of Pseudomonas aeruginosa Upon Exposure to Colistin and Tobramycin
Pseudomonas aeruginosa Gene Expression Under Biofilm Conditions
Analysis of Gene Expression in Pseudomonas aeruginosa
Last updated January 22, 2025