
Crafting Your Comparative Public Transport Study: Rome vs. Lusaka with the Kano Model
A blueprint for structuring research on customer satisfaction across diverse urban transit systems.
Formulating a research topic that effectively compares customer satisfaction in public transport between cities as distinct as Rome, Italy, and Lusaka, Zambia, requires a structured approach. Utilizing the Kano model provides a powerful framework for understanding not just *what* customers value, but *how* different quality features impact their satisfaction levels. This guide outlines the steps and considerations for building a robust research topic focused on this comparison.
Essential Insights for Your Research Plan
- Focus on Comparative Analysis: The core strength of this research lies in contrasting the public transport expectations and satisfaction drivers between a historic European capital (Rome) and a rapidly developing African city (Lusaka).
- Leverage the Kano Model's Nuance: Go beyond simple satisfaction ratings. Use the Kano model to categorize features (Must-be, One-dimensional, Attractive, Indifferent, Reverse) to understand their specific impact in each unique urban context.
- Tailor Methodology to Context: Recognize that data collection methods (surveys, interviews) and the specific quality features investigated may need adaptation to suit the cultural, socio-economic, and infrastructural realities of both Rome and Lusaka.
Understanding the Core Components
Before formulating the specific topic, it's crucial to grasp the key elements involved: the analytical tool (Kano Model) and the distinct contexts of the two cities.
The Kano Model: Deciphering Customer Needs
Developed by Professor Noriaki Kano, this model provides a sophisticated way to understand customer preferences by classifying product or service attributes based on how they affect customer satisfaction. It moves beyond a simple linear view ("more is better") to capture more complex relationships:
- Must-be Attributes: Basic expectations. Their absence leads to extreme dissatisfaction, but their presence is taken for granted and doesn't significantly increase satisfaction (e.g., basic safety features on a bus).
- One-dimensional (Performance) Attributes: Satisfaction is directly proportional to the level of fulfillment. The better the performance, the higher the satisfaction (e.g., frequency of service, travel time).
- Attractive (Excitement) Attributes: Unexpected features that delight customers when present but do not cause dissatisfaction if absent (e.g., free onboard Wi-Fi, exceptionally helpful staff).
- Indifferent Attributes: Features that customers don't particularly care about, having little impact on satisfaction whether present or absent.
- Reverse Attributes: Features whose presence can cause dissatisfaction (e.g., overly complex ticketing systems, features perceived as intrusive).
Applying this model helps prioritize improvements by focusing on features that yield the greatest positive impact on user experience.
Setting the Scene: Public Transport Contexts
Rome, Italy
Rome's public transport system operates within a dense, historic city. Its legacy includes an extensive road network dating back to the Roman Empire. Today, it features a multi-modal system including metro lines, buses, trams, and suburban railways. Key characteristics and potential user concerns include:
- Integration with historical infrastructure, sometimes leading to limitations.
- Potential issues with punctuality, crowding, and vehicle age/cleanliness.
- Extensive network coverage but navigating it can be complex for tourists and locals alike.
- Ongoing investments aim to modernize and improve efficiency, often influenced by tourism demands and EU standards.
Lusaka, Zambia
Lusaka, as a major city in a developing nation, presents a different public transport landscape. It is often characterized by:
- Heavy reliance on privately-operated minibuses, often with less formal routing and scheduling.
- Challenges related to infrastructure development, road congestion, and traffic management.
- Concerns about safety, vehicle condition, driver behavior, and affordability are often paramount for users.
- Recent initiatives, like the Digital Transport 4 Africa (DT4A) project, are focused on mapping the system, assessing environmental impacts, and promoting more sustainable and accessible options.
- Investments in infrastructure (ring roads, traffic lights) and exploring travel demand management are seen as crucial for improvement.
Understanding these distinct backgrounds is vital for identifying relevant quality features and interpreting customer satisfaction data in each city.
Formulating Your Research Topic and Questions
Based on the context and the Kano framework, you can now structure your research focus.
Potential Research Topic Titles
Consider titles that clearly articulate the scope, methodology, and comparative nature:- "Applying the Kano Model to Assess Public Transport Quality Features and Customer Satisfaction: A Comparative Study of Rome, Italy, and Lusaka, Zambia."
- "Identifying Key Drivers of Customer Satisfaction in Urban Public Transport: A Kano Model-Based Comparison Between Rome and Lusaka."
- "Must-haves vs. Delighters: A Cross-Cultural Analysis of Public Transport Quality Preferences in Rome and Lusaka using the Kano Framework."
- "Evaluating Public Transport Service Quality Through the Lens of the Kano Model: Contrasting User Expectations in Rome and Lusaka."
Defining Research Objectives
Your objectives should be specific and measurable:- To identify the key quality attributes of public transport services perceived by users in Rome and Lusaka.
- To categorize these identified attributes using the Kano model (Must-be, One-dimensional, Attractive, Indifferent, Reverse) for both cities.
- To quantitatively and qualitatively compare the importance and impact of these quality attributes on overall customer satisfaction between Rome and Lusaka.
- To analyze the differences and similarities in customer expectations and satisfaction drivers based on the distinct urban contexts.
- To provide actionable recommendations for public transport authorities and operators in both cities to prioritize service improvements based on the Kano analysis.
Developing Research Questions
These questions guide the investigation:- What specific public transport quality features (e.g., punctuality, cost, safety, comfort, information availability) are most critical to users in Rome and Lusaka?
- How do these features classify within the Kano model categories for each city's user base? Are there significant differences in classification (e.g., is 'safety' a Must-be in Lusaka but taken for granted more in Rome)?
- Which attributes act as primary 'Satisfiers' (One-dimensional, Attractive) and 'Dissatisfiers' (Must-be, Reverse) in each context?
- How do socio-demographic factors (e.g., age, income, frequency of use) influence the perception and classification of quality features in Rome versus Lusaka?
- What practical implications do the findings have for targeted investments and policy decisions aimed at enhancing public transport satisfaction in these diverse urban environments?
Visualizing Kano Priorities: Rome vs. Lusaka
The Kano model helps understand how different features drive satisfaction. A radar chart can offer a visual hypothesis of how various quality dimensions might be prioritized differently by users in Rome and Lusaka, based on general expectations and context. This hypothetical chart illustrates potential differences across key quality attributes, rated on a scale reflecting their likely impact on satisfaction (higher scores indicating greater positive impact or necessity).
Note: This chart represents a hypothetical visualization based on assumed contexts. Actual research data would be required to confirm these priorities.
Structuring Your Research Methodology
A sound methodology is essential for generating credible findings.
Key Methodological Steps
- Literature Review: Thoroughly review existing research on public transport satisfaction, the Kano model's application in service industries (especially transport), and studies specific to urban mobility in Rome and Lusaka.
- Questionnaire Design: Develop a standardized questionnaire incorporating the Kano methodology. This typically involves asking pairs of questions for each quality feature:
- A functional question (How would you feel if this feature *is* present/well-performing?).
- A dysfunctional question (How would you feel if this feature *is not* present/poorly performing?).
- Response options usually range from 'I like it' to 'I dislike it'.
- Data Collection:
- Define your target population (public transport users in both cities).
- Employ appropriate sampling techniques (e.g., stratified random sampling, convenience sampling at transport hubs) to gather representative data in Rome and Lusaka.
- Consider surveys (online or in-person) and potentially supplement with qualitative methods like focus groups or short interviews for deeper insights.
- Data Analysis:
- Use the Kano evaluation table to categorize each feature based on responses to the functional/dysfunctional questions.
- Calculate customer satisfaction coefficients (Satisfaction Increment SI and Dissatisfaction Decrement DI) to quantify the impact of each feature.
- Employ statistical methods (descriptive statistics, chi-square tests, t-tests, ANOVA) to compare findings between Rome and Lusaka and across different demographic groups.
- Visualize results using charts and graphs.
Potential Quality Features and Hypothetical Kano Categories
The following table outlines potential quality features and hypothesizes their likely Kano classification in each city, demonstrating the comparative aspect. Actual classification would depend on survey data.
| Quality Feature | Hypothetical Kano Category (Rome) | Hypothetical Kano Category (Lusaka) | Rationale for Difference (Example) |
|---|---|---|---|
| Service Punctuality | One-dimensional / Must-be | One-dimensional / Attractive | Higher baseline expectation in Rome; achieving consistent punctuality might be a 'delighter' given Lusaka's context. |
| Personal Safety (during travel) | Must-be | Must-be / One-dimensional | A fundamental expectation everywhere, but potentially a stronger performance driver in Lusaka due to perceived risks. |
| Ticket Affordability | One-dimensional | Must-be / One-dimensional | Cost sensitivity likely higher in Lusaka, making affordability a basic necessity for many. |
| Vehicle Cleanliness | One-dimensional / Must-be | One-dimensional / Attractive | Higher baseline expectation for cleanliness in Rome; exceptional cleanliness might be an 'attractive' feature in Lusaka. |
| Real-time Information (Apps/Displays) | One-dimensional / Attractive | Attractive / Indifferent | More expected/performance-based in Rome; potentially a novel 'delighter' or 'indifferent' in Lusaka depending on tech access. |
| Ease of Ticketing Purchase | One-dimensional / Must-be | One-dimensional / Attractive | Seamless digital options expected in Rome; simpler, accessible physical ticketing might be key in Lusaka. |
| Network Coverage/Reach | One-dimensional | One-dimensional | Likely a performance driver in both cities, crucial for accessibility. |
| Comfort (Seat availability, AC/Heating) | One-dimensional | Attractive / One-dimensional | Basic comfort expected in Rome; enhanced comfort features might be 'attractive' in Lusaka's standard transit modes. |
Mapping Your Research Structure
A mindmap can help visualize the interconnected components of your proposed research project.
Visual Context: Public Transport Environments
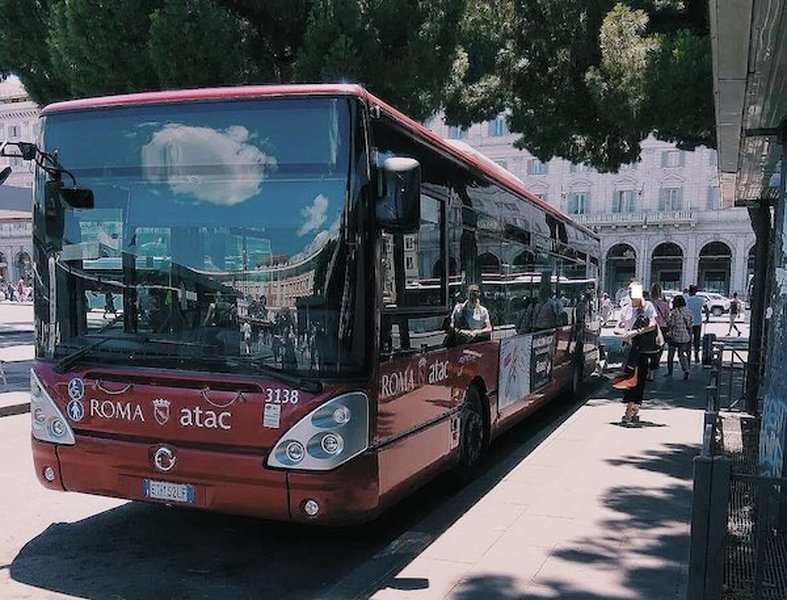
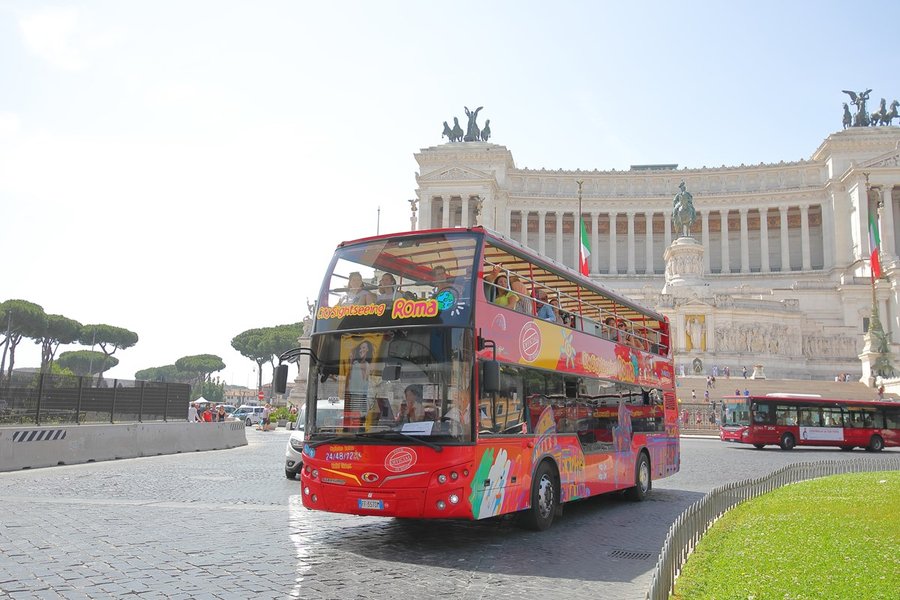
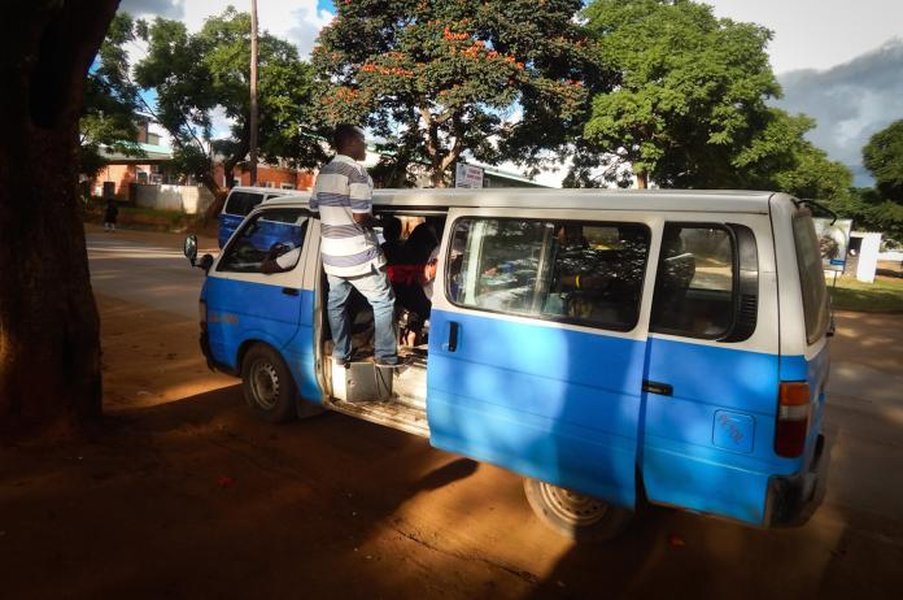
The visual differences between public transport systems in Rome and Lusaka underscore the distinct environments your research will explore. Rome's system often involves modern buses and trams navigating historic streets, while Lusaka relies heavily on minibuses operating in a rapidly urbanizing setting. These visual cues hint at potentially different user priorities regarding infrastructure, vehicle type, and service formality.
Understanding the Kano Model Visually
To better grasp the core methodology of your proposed research, this video provides a clear explanation of the Kano model, how it categorizes customer requirements, and its application in understanding satisfaction versus functionality. It details the different attribute types (Basic/Must-be, Performance/One-dimensional, Excitement/Attractive) and their non-linear relationship with customer satisfaction, which is central to your comparative study between Rome and Lusaka.
Potential Outcomes and Significance
This research holds significant potential for both academic contribution and practical application:
- Academic Contribution: It will add to the body of knowledge on cross-cultural and cross-contextual differences in public transport customer satisfaction. It demonstrates the application of the Kano model in diverse urban settings within the transport sector.
- Practical Implications for Rome: Findings can help pinpoint specific areas for improvement beyond basic functionality, potentially focusing on enhancing 'Attractive' attributes or refining 'One-dimensional' features like real-time information or comfort to boost satisfaction in a competitive European context.
- Practical Implications for Lusaka: The research can highlight critical 'Must-be' attributes (like safety and affordability) that require immediate attention and investment. It can also identify emerging 'One-dimensional' or 'Attractive' features that could guide future development towards a more user-centric system.
- Policy Guidance: Provides evidence-based insights for policymakers and transport planners in both cities to make informed decisions about resource allocation and service design priorities, contributing to more effective and sustainable urban mobility solutions.
Frequently Asked Questions (FAQs)
1. Why use the Kano model instead of just asking about satisfaction levels?
2. What are the main challenges in comparing Rome and Lusaka?
3. How can I ensure the survey questions are relevant to both cities?
4. Can the findings realistically influence policy in both cities?
References
- Empirical research on Kano's model and customer satisfaction - ResearchGate
-
Implementation of the Kano model in a company providing public transport services - ScienceDirect
- Applying the Kano Model and Importance–Performance Analysis to Explore Service Quality of Public Transport - MDPI
- Kano model - Wikipedia
- DT4A Launches Low-Carbon Transport Futures Project in Lusaka - Digital Transport 4 Africa
- Making Public Transport in Lusaka City more Efficient and Effective - IDS OpenDocs
-
Quality of public transport service in the city of Lusaka: a case - University of Zambia DSpace
Recommended Further Exploration
Last updated April 5, 2025