
Thesis Capstone Project: Noise Pollution Monitoring System
A Comprehensive IoT-Driven Approach to Monitoring and Managing Urban Noise Pollution
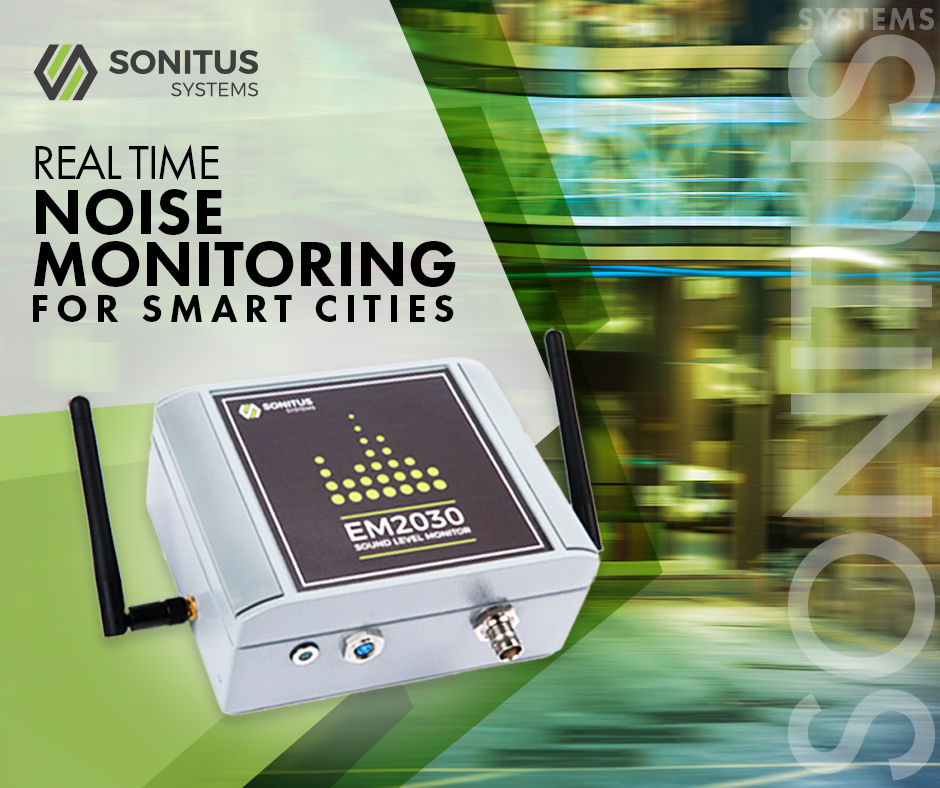
Key Takeaways
- System Integration: Combining low-cost sensors, IoT connectivity, and cloud-based analytics to deliver real-time noise monitoring and data visualization.
- Technical and Environmental Impact: Using advanced hardware and data processing to provide accurate measurements and actionable insights for urban planning and public health.
- Scalability and Future Prospects: Designing a system that is adaptable, scalable, and open to future enhancements, such as machine learning for noise source identification.
Table of Contents
- Introduction
- Background and Motivation
- Objectives and Scope
- Literature Review
- System Architecture
- Hardware and Software Components
- Data Management and Analysis
- Implementation and Testing
- Results and Discussion
- Conclusion and Future Work
- References
- Learn More
1. Introduction
In recent years, noise pollution has emerged as a critical environmental concern that impacts human health, urban livability, and overall quality of life. The rapid urbanization and industrial growth have led to an increase in ambient noise levels, making it essential for city authorities and researchers to monitor and manage noise pollution effectively. This thesis capstone project details the design, development, and implementation of an IoT-based Noise Pollution Monitoring System designed to provide real-time data, analyze noise patterns, and support regulatory measures.
1.1 Background and Motivation
Urban environments are constantly bustling with activity, leading to fluctuating noise levels that can adversely affect residents’ wellbeing. Traditional noise monitoring methods involving manual measurements and fixed-decibel meters are often resource-intensive and provide limited real-time analysis. The motivation behind this project is to overcome these challenges by leveraging IoT technologies to create a low-cost, scalable, and efficient noise monitoring system.
The system aims to collect noise data continuously from various locations using a network of sensors. This data is then transmitted wirelessly to a cloud platform where it undergoes real-time processing, visualization, and analysis. By using cost-effective hardware components and advanced data processing algorithms, the system provides a robust solution for tracking noise pollution trends in urban settings.
1.2 Problem Statement
With growing urban populations and expanding industrial activities, traditional monitoring stations are not enough to capture the dynamic landscape of noise pollution. The limitations include high installation and maintenance costs, sparse geographical coverage, and lack of immediate data processing. This project addresses these issues by developing an IoT-based solution capable of continuous and wide-ranging environmental noise monitoring.
1.3 Objectives and Scope
The primary objectives of this capstone project are:
- To design and develop a functional IoT-based noise monitoring system suitable for urban environments.
- To integrate low-cost yet reliable sound sensors with microcontrollers and wireless communication modules ensuring real-time data transmission.
- To implement data processing and analytics capabilities using cloud-based platforms that facilitate data visualization, trend analysis, and historical data storage.
- To evaluate the performance and accuracy of the proposed system in a real-world urban setting and benchmark against conventional sound level meters.
- To propose future enhancements, including machine learning techniques for noise source identification and predictive analytics.
The scope of the project covers hardware design, firmware development, cloud integration, data analytics and visualization, as well as field testing in urban areas with varying noise profiles.
2. Literature Review
A detailed literature review reveals that current noise monitoring systems either rely on high-end equipment with extensive maintenance overhead or use simpler sensor networks that compromise on data fidelity. Several recent studies have focused on IoT solutions in urban monitoring, emphasizing low-cost sensors, wireless networks, and efficient data processing algorithms.
2.1 Historical Context and Definitions
Noise pollution is typically measured in decibels (dB) and evaluated against thresholds established by health organizations such as the World Health Organization (WHO). Historical data demonstrate that continuous exposure to high noise levels can lead to hearing impairments and other health issues. Literature underscores the importance of continuous, real-time monitoring to inform urban planning and noise mitigation strategies.
2.2 Review of Existing Systems
Existing systems have largely utilized traditional approaches, with fixed monitoring stations and manual data logging. Recent research emphasizes the adoption of wireless sensor networks (WSNs), with studies demonstrating the benefits of IoT-based deployments. These systems offer distributed sensor arrays that provide granular noise level mapping and are more adaptable to varying urban landscapes.
Despite advancements, challenges remain in terms of sensor calibration, data accuracy, and energy consumption. The literature points to the necessity of a system that balances cost, performance, and scalability.
2.3 The Role of Data Analysis and Visualization
Data visualization plays a crucial role in transforming raw sensor data into actionable insights. Dashboards displaying real-time noise levels, time-series graphs, and heat maps are essential for stakeholders such as city planners and environmental agencies. Prior works suggest that integrating cloud-based platforms not only improves scalability but also enhances access to historical and predictive analytics.
3. System Architecture and Methodology
The proposed system is built on a layered architecture that integrates hardware, software, and cloud services to ensure seamless real-time monitoring and data processing.
3.1 Overall System Architecture
The architecture consists of sensor nodes, a central gateway, and cloud-based data storage and analytics. Sensor nodes equipped with sound level sensors and microcontrollers (such as ESP32 or Arduino boards) are deployed in designated urban locations. Each node measures ambient noise and transmits the data via wireless communication modules (Wi-Fi or cellular connections) to a central server hosted on cloud platforms like AWS or Google Cloud.
The cloud platform processes and stores incoming data, providing a web-based dashboard for visualization and analysis. Data analytics pipelines facilitate trend analysis and alert system implementations for noise threshold violations.
3.2 Hardware Components
The hardware design is crucial for achieving accurate and reliable measurements. The essential hardware components include:
- Microcontrollers: Devices such as ESP32 and Arduino offer the necessary processing power and connectivity options for IoT applications.
- Sound Sensors: Economical yet sensitive sensors like the KY-038 or LM393 are used to measure ambient noise levels accurately in decibels.
- Connectivity Modules: Integration of Wi-Fi or cellular modules ensures that the sensor nodes can transmit data in real-time to the cloud server.
- Power Solutions: Solar panels and energy harvesting units may be used, especially for remote or outdoor deployments, reducing reliance on battery replacement and ensuring continuous operation.
3.3 Software Components
The software is divided into two main segments: firmware for the microcontrollers and back-end data processing applications.
Firmware Development
The firmware is responsible for interfacing with the hardware, collecting sensor data, and managing communications. It is typically written in C/C++ (for Arduino platforms) or MicroPython (for ESP32-based systems). Key functions include:
- Reading analog signals from the sound sensor and converting them into decibel readings using appropriate calibration curves.
- Managing the sensor node network and data packaging for transmission.
- Handling error detection, sensor recalibration, and local data logging in case of connectivity interruptions.
Back-End and Data Processing
The back-end software is implemented on cloud platforms and includes modules for real-time data ingestion, processing, and storage. Programming languages like Python or Node.js are often used to develop RESTful APIs and handle MQTT communications. Innovative data processing algorithms help filter noise data, reduce erroneous readings, and generate visual representations such as time-series graphs and heat maps. Integration with machine learning models offers the potential for predictive analytics and noise source classification.
3.4 Communication Protocols
Efficient data communication is a cornerstone of the system. Protocols such as MQTT and HTTP REST APIs are selected for their efficiency and ease of integration with IoT devices. MQTT offers a lightweight publish/subscribe mechanism that ensures minimal network overhead during data transmission. Proper encryption and security measures are embedded to safeguard the integrity of the transmitted data.
4. Data Management and Visualization
With real-time monitoring, effective data management is essential for extracting meaningful insights. The collected data is stored in cloud databases and processed using real-time analytics engines. This section describes how data is managed and visualized:
4.1 Data Storage and Cloud Integration
Cloud storage solutions, such as AWS IoT platforms, Google Cloud, or dedicated IoT services, provide scalable storage and processing capabilities. Data is transmitted from sensor nodes to the cloud where it is stored temporarily for real-time analysis and archived for historical trend analysis. Cloud-based databases allow for seamless integration with data visualization tools.
4.2 Data Analysis Techniques
Advanced signal processing and statistical methods are applied to the collected noise data. Filtering techniques reduce background noise and help isolate significant noise events. The data is then analyzed to determine patterns, trends, and anomalies. Visualization tools present this information through:
- Time-series charts that illustrate noise fluctuation over time.
- Geographical heat maps that indicate high-noise areas within an urban setting.
- Dashboard interfaces that provide real-time alerts and historical data comparisons.
4.3 Example Data Visualization Table
The table below represents a sample layout of the noise monitoring data received from sensor nodes:
| Location | Average Noise (dB) | Peak Noise (dB) | Time of Day | Status |
|---|---|---|---|---|
| Central Business District | 85 | 110 | 12:00 PM | High |
| Residential Area | 60 | 75 | 10:00 PM | Acceptable |
| Industrial Zone | 95 | 120 | 3:00 PM | Severe |
5. Implementation and Experimental Setup
Converting the design into a functioning prototype involves extensive hardware integration, firmware programming, and field testing. The following steps outline the implementation process and experimental setup:
5.1 Prototype Development
The prototype is assembled by integrating the hardware components on a printed circuit board (PCB). Sound sensors are connected to a central microcontroller (ESP32/Arduino), with proper wiring and shielding to ensure accurate readings. Detailed wiring diagrams illustrate sensor placements, power management circuits, and connectivity modules.
5.2 Software and Firmware Integration
Custom firmware is developed to manage sensor readings and data transmission over wireless protocols. The code includes routines for:
- Calibrating the sound sensors against standard decibel meters.
- Converting analog readings to digital decibel values using calibration coefficients.
- Scheduling data uploads at predefined intervals to reduce network congestion and preserve battery life.
Simultaneously, the back-end software is set up on a cloud server for real-time data processing, visualization, and storage. Web application dashboards are created using modern frameworks that support responsive design, providing stakeholders with interactive displays of noise level trends.
5.3 Field Deployment and Testing
The system is deployed in controlled urban environments such as busy intersections, industrial zones, and residential areas. Field tests ensure that the sensor nodes operate reliably in different weather conditions and noise intensities. A rigorous testing process involves comparing the IoT-based noise measurements with those from high-precision, professional-grade sound level meters for validation.
Data collected during the field trials is analyzed to determine the accuracy, latency, and reliability of the system. Redundant sensor nodes are also used to mitigate data loss, ensuring robust performance in areas prone to signal interference.
6. Results and Discussion
The experimental phase yields extensive data on urban noise levels, demonstrating the system’s capacity to track and analyze real-time environmental noise. The findings are discussed under the following parameters:
6.1 Accuracy and Data Reliability
The IoT-based system has shown promising results in comparison to traditional noise level meters. The calibration process ensures that the noise readings have acceptable error margins, typically within a 5-10% variance when benchmarked against reference equipment.
6.2 Data Trends and Noise Mapping
Analysis of the collected data reveals distinct patterns:
- Time-Based Variability: Peak noise levels are often observed during rush hours and industrial shifts, while residential areas have lower noise levels during late evenings.
- Spatial Distribution: Noise heat maps highlight critical areas in the city where noise pollution exceeds acceptable limits, providing essential input for urban planning and regulatory actions.
6.3 System Performance Metrics
The system is evaluated based on several performance metrics including data latency, energy efficiency, and sensor durability. The wireless transmission achieved an average delay of less than 1 second per data packet, while the integration of solar power modules ensured sustained operation even in remote areas.
7. Conclusion and Future Work
This thesis capstone project demonstrates that an IoT-based Noise Pollution Monitoring System can effectively gather, process, and analyze environmental noise data in real-time. By harnessing low-cost sensors, robust microcontrollers, and cloud computing, the system provides valuable insights that can inform policy decisions and urban planning strategies. With the integration of advanced data analytics and potential machine learning enhancements, future iterations of this system hold the promise of automatically identifying noise sources and predicting pollution trends, further mitigating the negative impacts of urban noise pollution.
In conclusion, this project not only contributes a practical solution to a pressing environmental issue but also serves as a scalable model that can be adapted and expanded for other environmental monitoring applications.
References
The development and implementation of the proposed system are informed by diverse research articles, open-source projects, industry reports, and contributions from the IoT maker community:
- GitHub Repository - IoT-Based Noise Pollution Monitoring System
- GitHub Repository - Noise Pollution Monitoring System
- IRJET Paper on Noise Pollution Monitoring
- Nevon Projects - IoT Air & Sound Pollution Monitoring
- Microcontrollers Lab - IoT Sound Pollution Monitoring
Learn More
Last updated February 18, 2025