
Unlocking the Best Overdraft: Analyzing YU Company's New Banking Offers & Visual Presentation Guide
A detailed look into choosing the optimal overdraft and effectively presenting your new financial options using circle diagrams.
Key Insights at a Glance
- New Overdraft Contenders: YU Company has new offers from ABC Bank (7M at 7.5% interest) and Capital Bank (15M at 7.75% interest).
- Strategic Choice Required: The "best" new offer depends on YU Company's immediate financial priorities – a lower interest rate with ABC or a larger facility with Capital.
- Visualizing with Circle Diagrams: Circle diagrams (pie charts) are ideal for illustrating the proportional share of the total new overdraft facility offered by each bank, aiding clear communication.
Understanding YU Company's Current Financial Landscape
A Snapshot of Existing Overdraft Accounts
Before evaluating new opportunities, it's crucial to understand YU Company's current overdraft arrangements. These provide a baseline against which new offers can be compared. The existing facilities are:
- CAAB: 17 million (M) at a 7% interest rate.
- Housing: 30M at a 7.65% interest rate.
- Kuwait: 10M at an 8% interest rate.
- Union: 13M at a 9.1% interest rate.
These existing accounts vary in both size and cost, highlighting the importance of carefully selecting any new or replacement facilities.
Evaluating the New Overdraft Opportunities
The Contenders: ABC Bank vs. Capital Bank
YU Company has received two new overdraft offers, each with distinct terms:
- ABC Bank: Offers an overdraft facility of 7M with an interest rate of 7.5%.
- Capital Bank: Offers a larger overdraft facility of 15M with an interest rate of 7.75%.
To make an informed decision, let's delve into what these figures mean for YU Company.
Making the "Best" Choice: Balancing Needs and Costs
The "best" offer isn't universally defined; it hinges on YU Company's specific requirements and financial strategy. Here’s a breakdown to aid in this decision:
Prioritizing Lower Interest Cost
If the primary goal is to minimize interest expenses for a relatively smaller overdraft need, ABC Bank's offer is more attractive. At 7.5%, its interest rate is lower than Capital Bank's 7.75%. This could translate to significant savings over time, especially if the overdraft is utilized frequently. This rate is also competitive when compared to some of YU Company's existing facilities, though slightly higher than CAAB's 7%.
Requiring a Larger Facility
If YU Company anticipates needing a more substantial overdraft facility to manage cash flow or fund larger projects, Capital Bank's offer of 15M is the clear winner in terms of amount. While the interest rate is marginally higher at 7.75%, the access to more than double the funds compared to ABC's offer might be a crucial factor. The slightly higher rate could be a worthwhile trade-off for the increased financial flexibility.
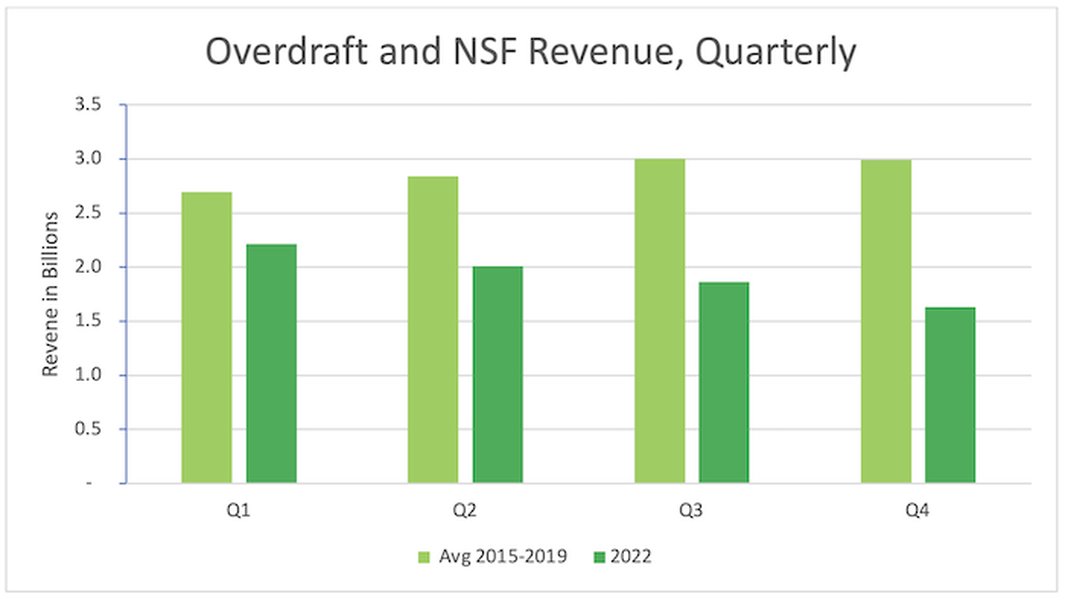
Chart illustrating trends in bank revenue from overdraft and Non-Sufficient Funds (NSF) fees. Selecting overdrafts with favorable terms is crucial for cost management.
Strategic Considerations for YU Company
Beyond the headline figures, YU Company should also consider:
- Overall Portfolio: How do these new offers fit with existing overdrafts? Could a new offer replace a more expensive current one?
- Negotiation: Is there room to negotiate terms with either bank, perhaps leveraging YU Company's relationship or the competitive nature of the offers?
- Associated Fees: Are there any setup fees, maintenance fees, or non-utilization fees associated with these new offers? These should be factored into the total cost.
- Long-term Needs: Does the company anticipate its borrowing needs changing in the near future? Choosing an offer that aligns with future growth can be beneficial.
Comparative Analysis: Visualizing Overdraft Offer Metrics
Radar Chart Evaluation
To provide a multi-dimensional comparison, the radar chart below evaluates the new offers from ABC and Capital against two of YU Company's significant current overdrafts: CAAB (lowest existing interest rate) and Housing (largest existing facility). The chart assesses them across four key metrics:
- Facility Amount (M): The size of the overdraft offered. Higher is generally better.
- Interest Rate Score (10-Rate): Calculated as 10 minus the actual interest rate (%). A higher score indicates a more favorable (lower) interest rate.
- Perceived Overall Value (1-5): A qualitative assessment of the offer's balance between cost and benefit (5 being highest value).
- New Offer Accessibility (1-5): Reflects the ease of setting up and accessing the facility, with new offers typically scoring higher (5 being most accessible). For existing accounts, this reflects their current availability rather than a new setup process.
This visualization helps to quickly identify the strengths and weaknesses of each option from different perspectives.
From the radar chart, YU Company can see that while 'Housing (Existing)' offers the largest facility amount, 'CAAB (Existing)' has the best interest rate score. The new offers from 'ABC' and 'Capital' show strong accessibility and competitive values, with ABC having a better rate score and Capital offering a larger amount than ABC.
Presenting the New Offers: The Power of Circle Diagrams
What is a Circle Diagram (Pie Chart)?
A circle diagram, commonly known as a pie chart, is a visual tool used to represent proportions or percentages. Each "slice" of the pie corresponds to a category, and the size of the slice is proportional to that category's share of the total. For presenting YU Company's new overdraft offers, a pie chart can effectively show how the total newly available overdraft facility is divided between ABC Bank and Capital Bank.
Visual example of a circular diagram template, often used to present financial information and proportions in banking.
Crafting Your Circle Diagram for New Offers: A Step-by-Step Guide
To present the new offers from ABC and Capital banks in a circle diagram, follow these steps:
Step 1: Calculate Proportions of the Total New Facility
First, determine the total amount of new overdraft facility being offered and the proportion each bank contributes:
- ABC Bank Offer: 7M
- Capital Bank Offer: 15M
- Total New Facility: 7M + 15M = 22M
Now, calculate the percentage share for each bank:
- ABC Bank's Share: (7M / 22M) * 100% ≈ 31.82%
- Capital Bank's Share: (15M / 22M) * 100% ≈ 68.18%
Step 2: Design the Diagram
Using spreadsheet software (like Excel or Google Sheets) or presentation tools (like PowerPoint or Canva), create a pie chart with two segments based on these percentages:
- One segment representing ABC Bank (approx. 31.82% of the circle).
- Another larger segment representing Capital Bank (approx. 68.18% of the circle).
Ensure your diagram includes:
- Clear Labels: Each segment should be labeled with the bank's name (ABC, Capital), the amount offered (7M, 15M), and its percentage share. You might also note the interest rate (7.5%, 7.75%) directly on or next to the segment.
- Distinct Colors: Use different, easily distinguishable colors for each segment.
- A Title: Give your chart a clear title, such as "Distribution of New Overdraft Offers by Amount."
- Legend (Optional): If colors aren't directly labeled, a legend can clarify which color corresponds to which bank.
Step 3: Interpretation and Presentation
When presenting this circle diagram, explain that it visually demonstrates the relative size of the overdraft facilities offered by ABC and Capital. It makes it immediately apparent that Capital Bank is offering a significantly larger portion of the total new available overdraft funds. This visual can be a powerful way to initiate discussions about which offer aligns better with YU Company's needs for facility size.
Conceptualizing Your Presentation: A Mindmap Approach
Structuring the New Overdraft Offer Comparison
A mindmap can help organize the key information you'll want to convey when presenting the new overdraft offers, especially when incorporating a circle diagram. The mindmap below outlines the core components for such a presentation, focusing on how the circle diagram fits into the narrative of comparing ABC Bank and Capital Bank.
This mindmap illustrates how the circle diagram serves as a central piece in visually communicating the new offers. It breaks down the total new facility into its constituent parts, allowing stakeholders to quickly grasp the scale of each bank's proposition regarding the overdraft amount.
Consolidated View of YU Company's Overdraft Options
Comprehensive Comparison Table
To provide a full overview, the table below details all of YU Company's current overdraft accounts alongside the new offers from ABC and Capital. It includes the overdraft amount, interest rate, the type of offer (current or new), and an illustrative estimate of annual interest if the facility were fully utilized for a year. This helps in comparing the costs and benefits across all available options.
| Bank/Company | Amount (M) | Interest Rate (%) | Type | Illustrative Annual Interest (M) |
|---|---|---|---|---|
| CAAB | 17 | 7.00 | Current | 1.19 |
| Housing | 30 | 7.65 | Current | 2.295 |
| Kuwait | 10 | 8.00 | Current | 0.80 |
| Union | 13 | 9.10 | Current | 1.183 |
| ABC (New Offer) | 7 | 7.50 | New | 0.525 |
| Capital (New Offer) | 15 | 7.75 | New | 1.1625 |
Note: The Illustrative Annual Interest is calculated as Amount * Interest Rate and assumes full utilization for one year. Actual costs may vary based on usage patterns and any additional fees.
This consolidated table allows for direct comparison. For instance, ABC's new offer has the lowest illustrative annual interest among all listed options, while Housing provides the largest facility but with a correspondingly high illustrative interest cost.
Deeper Insights: Understanding and Managing Overdrafts
Navigating Overdraft Options Wisely
Choosing and managing overdrafts effectively is a key component of sound financial management for any company. Overdrafts can provide essential liquidity, but their costs can escalate if not carefully monitored. Understanding the terms, interest rates, and potential fees is crucial. The video below offers insights into bank accounts and overdraft considerations, which can be helpful in making informed decisions about your company's banking relationships and borrowing facilities. While specific to a particular year and market, the general principles often apply.
This video discusses considerations for bank accounts and overdrafts, aiming to help viewers find options with lower interest rates.
Key takeaways from such discussions often revolve around:
- Comparison Shopping: Don't settle for the first offer. Compare rates, fees, and terms from multiple institutions.
- Understanding True Cost: Look beyond the headline interest rate. Factor in all potential fees (arrangement fees, non-utilization fees, renewal fees).
- Usage Strategy: Use overdrafts for short-term cash flow needs rather than long-term financing, as they are typically more expensive than other forms of debt.
- Regular Review: Periodically review your overdraft facilities to ensure they still meet your needs and remain competitive in the market.
Frequently Asked Questions (FAQ)
Which new overdraft offer is definitively the "best" for YU Company?
There isn't a single "best" offer; it depends on YU Company's specific priorities. If the main goal is the lowest possible interest rate for a smaller facility, ABC Bank's offer (7M at 7.5%) is preferable due to its lower rate. If YU Company requires a larger overdraft amount and can accommodate a slightly higher interest rate, Capital Bank's offer (15M at 7.75%) provides significantly more funds. The decision involves weighing the need for a larger facility against the cost of borrowing.
What is the main purpose of using a circle diagram (pie chart) for these new offers?
The primary purpose of using a circle diagram (pie chart) in this context is to visually represent the proportion of the total new overdraft facility that each bank (ABC and Capital) offers. It provides an immediate, easy-to-understand comparison of the amounts offered by each bank relative to the combined total of new offers. This helps stakeholders quickly see, for example, that Capital Bank's offer constitutes a larger share of the newly available funds.
Can I compare the new offers with my current overdrafts using a single circle diagram?
While you could technically include all offers in one circle diagram representing, for instance, the proportion of total available credit (current + new) from each source, it might become cluttered and less effective. Circle diagrams are best for showing parts of a single, coherent whole. For comparing distinct offers, especially when evaluating multiple metrics like interest rates alongside amounts, other visual tools like bar charts or the provided comprehensive table are often clearer. You could, however, create:
- One pie chart for the distribution of new offer amounts (as discussed).
- A separate pie chart showing the distribution of your current overdraft facility amounts.
What factors, other than amount and interest rate, should YU Company consider when choosing an overdraft offer?
Beyond the principal amount and interest rate, several other factors are important:
- Fees: Look for arrangement fees, renewal fees, non-utilization fees, or fees for exceeding the overdraft limit. These can significantly impact the overall cost.
- Terms and Conditions: Understand the full terms, including repayment conditions, review clauses, and any security requirements.
- Bank Relationship: Consider the existing or potential relationship with the bank. A strong relationship can sometimes lead to better terms or more flexible support.
- Ease of Setup and Management: How straightforward is the application process? How easy will it be to manage the account and access funds?
- Flexibility: Does the overdraft offer flexibility, such as the ability to easily increase or decrease the limit as business needs change?
- Notice Periods: Are there any notice periods for changes to the facility or its terms by the bank?
Recommended Next Steps & Further Exploration
To deepen your understanding and make the most informed decisions, consider exploring these related queries:
- How can YU Company effectively negotiate overdraft terms and conditions with potential banks?
- What are the most common hidden fees associated with business overdraft facilities and how can they be avoided?
- What are best practice strategies for managing multiple overdraft accounts to optimize cash flow for a business like YU Company?
- Beyond pie charts, what are other effective visual tools for comparing financial products like overdrafts in a business presentation?
References
The following resources provide further information on financial presentations, data visualization, and overdraft considerations:
Last updated May 17, 2025