
Decoding Your Night: A Deep Dive into Sleep Radar Charts
Unveiling the Multivariate Insights of Your Restful Journey
Sleep is a fundamental pillar of health, influencing everything from cognitive function to emotional well-being. Understanding its intricate patterns is crucial for optimizing rest and improving overall quality of life. Traditionally, sleep data might be presented in simple graphs, but a more sophisticated tool, the radar chart, offers a compelling visual representation of multifaceted sleep parameters. By consolidating various aspects of your nightly rest onto a single, intuitive display, sleep radar charts provide a holistic overview, allowing for quick identification of strengths and areas for improvement in your sleep hygiene.
Key Insights into Sleep Radar Charts
- Multidimensional Sleep Assessment: Radar charts excel at visualizing multiple quantitative variables simultaneously, making them ideal for assessing various aspects of sleep quality, such as sleep onset, deep sleep duration, awakenings, and regularity.
- Pattern Recognition and Comparison: These charts enable users to quickly identify patterns in their sleep over time and compare their nightly performance against personal averages or desired benchmarks, fostering evidence-based adjustments to sleep habits.
- Empowering Self-Monitoring: With increasing accessibility through sleep tracking applications and devices, radar charts offer an engaging and comprehensive way for individuals to self-monitor and gain deeper insights into their unique sleep architecture.
Understanding the Essence of Sleep Radar Charts
What is a Radar Chart?
A radar chart, also known as a spider chart or web diagram, is a graphical method for displaying multivariate data in the form of a two-dimensional chart with three or more quantitative variables represented on axes originating from the same central point. Each "spoke" or radius of the chart represents a different variable, and the length of a spoke from the center is proportional to the magnitude of that variable for a specific data point. When multiple data points or observations are plotted, they form a polygon that reveals the variations and relationships between the variables.
In the context of sleep, radar charts transform complex sleep metrics into an easily digestible visual. This allows for a quick grasp of how different aspects of sleep quality interrelate and how they compare over different nights or against ideal profiles.
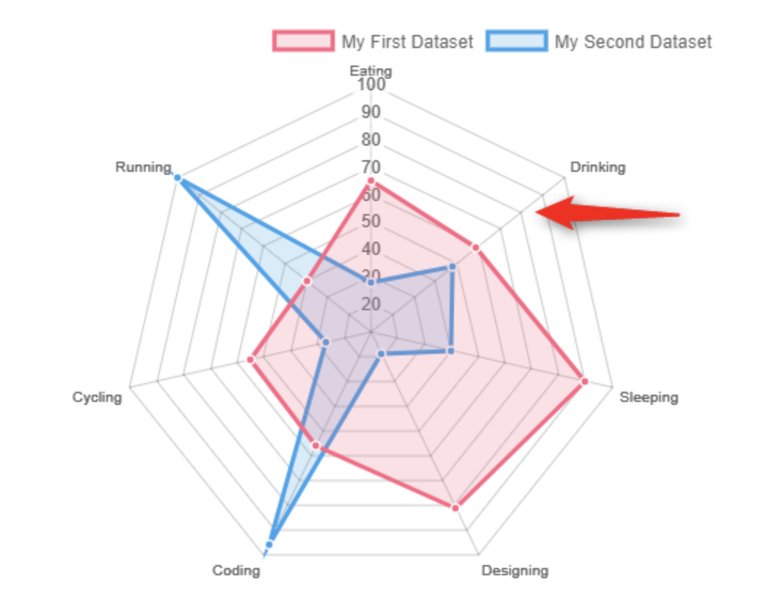
An example of a basic radar chart demonstrating its structure with multiple axes.
The Power of Visualizing Sleep Data
The human sleep cycle is a complex symphony of distinct stages, each vital for physical and mental restoration. These stages include Non-Rapid Eye Movement (NREM) sleep, comprising light sleep (N1, N2) and deep sleep (N3 or Slow-Wave Sleep), and Rapid Eye Movement (REM) sleep. A typical adult cycles through these four stages multiple times throughout the night, with each cycle lasting approximately 90–110 minutes.
Tracking and visualizing these stages, alongside other sleep-related factors like awakenings, sleep onset latency (time to fall asleep), and sleep regularity, provides valuable insights. Radar charts help consolidate these diverse data points into a single, comprehensive view, making it easier to identify patterns, potential disturbances, and areas where sleep quality might be compromised.
Common Parameters Visualized in Sleep Radar Charts
Key Metrics for Comprehensive Sleep Analysis
When constructing a sleep radar chart, several critical parameters are often included to provide a holistic view of sleep quality. These metrics are typically gathered through sleep tracking devices or self-rating scales:
Sleep Onset Latency
This refers to the amount of time it takes to fall asleep once you lie down and intend to sleep. On a radar chart, a higher score (further from the center) would indicate a quicker sleep onset, which is generally desirable. A shorter latency suggests efficient transition into sleep.
Deep Sleep Duration
Deep sleep (N3) is crucial for physical recovery, cellular repair, and immune system fortification. A significant portion of your total sleep should ideally be spent in this stage. On a radar chart, a longer duration of deep sleep would extend further along its axis, signifying better restorative sleep.
REM Sleep Duration
REM sleep is vital for cognitive functions, memory consolidation, and emotional regulation. While typically shorter in the early cycles, its duration increases as the night progresses. A healthy amount of REM sleep is indicated by a strong presence on its respective axis.
Light Sleep Duration
Light sleep (N1 and N2) acts as a transitional phase, preparing the body for deeper stages and comprising the largest portion of total sleep. While not as restorative as deep or REM sleep, it is a necessary component of the sleep cycle. The proportion of light sleep can indicate sleep efficiency.
Awakenings (Sleep Fragmentation)
This metric quantifies the number or duration of brief awakenings during the night. Fewer awakenings indicate more consolidated and uninterrupted sleep, which is highly beneficial for overall sleep quality. On a radar chart, fewer awakenings might be represented by a greater score or a shorter distance from the center, depending on the scoring system.
Sleep Regularity
Consistency in bedtime and wake-up times is a significant factor in maintaining a healthy circadian rhythm. A radar chart can reflect how well a person adheres to a regular sleep schedule, with higher scores indicating greater consistency.
Overall Sleep Quality Score
Many sleep trackers and self-assessment tools provide an aggregated "sleep score" that combines various parameters into a single metric. This score can serve as an overall indicator of how efficient and restorative a night's sleep was.
Illustrative Sleep Radar Chart: A Comparative Analysis
Visualizing Sleep Profiles
Below is an example of a sleep radar chart, created using Chart.js, comparing two hypothetical sleep profiles: "Optimal Sleep" and "Struggling Sleep." This chart demonstrates how different sleep parameters contribute to an overall sleep quality assessment.
In this radar chart:
- Optimal Sleep Profile (green polygon) demonstrates high scores across most axes, indicating quick sleep onset, sufficient deep and REM sleep, minimal awakenings, excellent regularity, and a high overall sleep quality score.
- Struggling Sleep Profile (yellow polygon) shows lower scores, particularly in sleep onset (longer time to fall asleep), reduced deep and REM sleep, more frequent awakenings, and inconsistent regularity, resulting in a lower overall sleep quality score.
The visual contrast between the two polygons immediately highlights the discrepancies in sleep quality. The larger and more symmetrical polygon of the "Optimal Sleep Profile" indicates a well-rounded and restorative sleep experience, whereas the smaller, more irregular shape of the "Struggling Sleep Profile" points to areas needing attention.
The Technology Behind Sleep Tracking and Radar Charts
How Sleep Data is Collected
Modern sleep tracking largely relies on various technologies to monitor sleep patterns. These include:
- Wearable Devices: Smartwatches (like Apple Watch), fitness trackers, and smart rings (like Oura Ring) utilize accelerometers to detect movement, heart rate sensors to measure pulse, and sometimes skin temperature sensors. These data points are processed by algorithms to infer sleep stages (awake, light, deep, REM).
- Non-Contact Sensors: Devices like the Google Nest Hub 2nd Gen and certain under-mattress sensors use radar technology or sensitive microphones. Radar sensors can detect subtle body movements and breathing patterns without direct physical contact, allowing for unobtrusive sleep monitoring. Advanced radar systems, including Ultra-Wideband (UWB) radar, have shown promise in classifying sleep stages with considerable accuracy by analyzing motion signals and breathing rates.
- Smartphone Apps: Applications like Sleep Cycle utilize a phone's microphone and accelerometer to analyze breathing and movement patterns, providing insights into sleep stages. These apps often leverage AI and machine learning, trained on extensive sleep data, to enhance accuracy.
From Raw Data to Insightful Visuals
Once sleep data is collected, it undergoes sophisticated processing. Algorithms analyze raw sensor data to identify distinct patterns corresponding to different sleep stages and events (e.g., awakenings, snoring, coughing). This processed data is then transformed into visual representations like radar charts. The development of self-rating scales for sleep disturbance has also enabled the expression of sleep complaints in a radar chart format, making it a valuable tool for both personal monitoring and clinical assessment.
Applications of Sleep Radar Charts
Personalized Sleep Improvement
For individuals, sleep radar charts offer a powerful tool for self-assessment and behavioral change. By regularly reviewing their sleep profile, users can:
- Identify Trends: Spotting consistent dips in certain parameters, such as deep sleep or regularity, can highlight areas needing attention.
- Evaluate Interventions: Users can test the impact of lifestyle changes (e.g., exercise, diet, bedtime routines) on their sleep by observing shifts in their radar chart over time.
- Monitor Progress: A larger, more symmetrical polygon on the radar chart over weeks or months indicates improved sleep quality.
An example of a sleep graph demonstrating various sleep stages and patterns.
Clinical and Research Applications
Beyond personal use, radar charts find utility in clinical settings and sleep research:
- Patient Monitoring: Clinicians can use these charts to visualize a patient's sleep complaints, assess the effectiveness of interventions, and track progress in managing sleep disorders.
- Research Studies: In studies involving sleep quality, radar charts can provide a concise way to compare sleep profiles across different groups (e.g., stress vs. non-stress groups) or evaluate the impact of new therapies. For instance, radar charts have been used to depict differing sleep quality in stress and non-stress groups.
- Consistency Assessment: Radar charts can be used to compare the consistency of sleep stage scoring rules among multiple sleep centers, aiding in standardizing diagnostic practices.
Understanding Sleep Stages and Cycles
The Four Stages of Sleep
A typical sleep cycle involves four distinct stages:
- NREM Stage 1 (N1): This is the lightest stage of sleep, a transitional period between wakefulness and sleep, lasting usually 5-10 minutes. Muscle activity lessens, and eye movements slow.
- NREM Stage 2 (N2): This stage is characterized by a further slowing of heart rate and breathing, a drop in body temperature, and the appearance of sleep spindles and K-complexes in brain wave activity. It accounts for about 50% of total sleep.
- NREM Stage 3 (N3): Known as deep sleep or slow-wave sleep, this is the most restorative stage. Brain activity shows delta waves, and it's difficult to wake someone in this stage. Physical recovery and immune system fortification occur here.
- REM (Rapid Eye Movement) Sleep: This stage is characterized by rapid eye movements, increased brain activity (similar to wakefulness), and temporary muscle paralysis. Dreaming is most vivid during REM sleep, and it plays a crucial role in memory consolidation and learning.
Adults typically need 7-9 hours of sleep per night and cycle through these stages 4-6 times. Each cycle typically lasts around 90-110 minutes, with the proportion of deep and REM sleep changing throughout the night.
This video from The Day Tomorrow Explores provides an in-depth look at REM sleep and its discovery, offering valuable context on this crucial sleep stage.
Comparing Sleep Tracking Technologies
A Glance at Popular Sleep Trackers
The market offers a variety of sleep trackers, each with its unique approach to data collection and presentation. Here's a comparison of some popular options and their features relevant to sleep analysis and radar chart potential:
| Feature/Device | Sleep Cycle App | Oura Ring | Google Nest Hub 2nd Gen | Apple Watch |
|---|---|---|---|---|
| Tracking Method | Microphone & Accelerometer (phone-based) | Optical Heart Rate, Accelerometer, Body Temperature (ring-based) | Soli Radar, Microphone (bedside device) | Accelerometer, Optical Heart Rate (wrist-based) |
| Sleep Stages Tracked | Awake, Light, Deep, Dream (REM) | Awake, REM, Light, Deep | Awake, Light, Deep, REM | Awake, REM, Core (Light), Deep |
| Key Sleep Metrics | Sleep duration, wake frequency, sleep stage dynamics, cough radar, snore detection | Sleep timing, regularity, efficiency, restorative sleep, heart rate, HRV, respiratory rate, body temperature | Sleep duration, sleep stages, disturbances (coughing, snoring, breathing irregularities) | Sleep duration, time in bed, sleep stages, heart rate, respiratory rate, average temperature |
| Data Visualization Potential | Hypnograms, trend charts, sleep score radar chart, statistics breakdown | Hypnograms, sleep regularity trends, sleep timing charts, readiness score, symptom radar | Daily sleep reports, trend analysis | Basic charts in Health app, some third-party app integration for deeper insights |
| Unobtrusive Tracking | Relatively unobtrusive (phone on nightstand) | Highly unobtrusive (ring worn on finger) | Completely unobtrusive (bedside radar) | Less obtrusive than chest straps, but still a wearable |
| Subscription Required for Full Features | Premium features may require subscription | Yes (for full data access) | No | No (basic features), third-party apps may have subscriptions |
While all these devices aim to provide insights into sleep, their methods and the depth of data visualization vary. Devices with integrated radar chart functionalities, or those that export data compatible with such visualizations, offer a superior experience for comprehensive sleep analysis.
Frequently Asked Questions About Sleep Radar Charts
What are the main benefits of using a sleep radar chart?
Can a radar chart help diagnose sleep disorders?
How accurate are sleep radar charts generated by consumer sleep trackers?
What specific sleep metrics are typically included in a sleep radar chart?
How often should I review my sleep radar chart for effective self-monitoring?
Conclusion
Sleep radar charts represent a significant advancement in personal health monitoring, offering a compelling visual tool for understanding and improving sleep quality. By synthesizing complex sleep data into an easily digestible format, these charts empower individuals to gain deep insights into their sleep patterns, identify areas for enhancement, and track the effectiveness of lifestyle adjustments. As technology continues to evolve, the integration of such sophisticated visualizations into everyday sleep tracking will undoubtedly play an increasingly vital role in promoting better sleep and overall well-being. The ability to see at a glance how various sleep parameters interact provides a unique perspective, moving beyond simple duration tracking to a more nuanced appreciation of sleep architecture.
Recommended Further Exploration
- How do wearable sleep trackers work?
- What are the benefits of deep sleep?
- Tips for improving sleep regularity
- Understanding REM sleep and dreaming
References
Last updated May 22, 2025