
Unveiling the Math Behind Fair Survey Results: How Are Responses Weighed?
Discover the statistical techniques used to ensure survey data accurately reflects the population it aims to represent.
When researchers conduct surveys, the group of people who respond (the sample) might not perfectly mirror the larger group they want to study (the target population). For instance, a survey might attract more younger participants than older ones, or more women than men, compared to their actual proportions in the population. Response weighting is a crucial statistical process used to correct these imbalances.
Essential Insights into Response Weighting
- Correcting Imbalances: Weighting adjusts survey data by giving more influence to responses from underrepresented groups and less influence to those from overrepresented groups, ensuring the final results accurately reflect the target population's characteristics (like age, gender, location).
- Mathematical Adjustment: The core of weighting involves calculating a specific 'weight' for each respondent or group. This weight is typically determined by the ratio of a group's proportion in the target population to its proportion in the survey sample.
- Statistical Methods: Several techniques exist to calculate weights, including Raking (Iterative Proportional Fitting), Post-Stratification, and Propensity Score Weighting, each suited for different scenarios and data complexities.
Why is Weighting Necessary? The Quest for Representative Data
Addressing Sampling Bias
The primary goal of weighting is to mitigate sampling bias. Bias occurs when the survey sample isn't representative of the target population. This can happen due to various reasons:
- Sampling Method: The way participants are selected might inadvertently favor certain groups.
- Non-response Bias: Specific groups might be less likely to participate in the survey than others. For example, people with lower incomes or less internet access might be underrepresented in online surveys.
- Coverage Error: The list or method used to reach potential respondents might not include everyone in the target population.
Without weighting, survey findings might be skewed, leading to inaccurate conclusions about the population's opinions, behaviors, or characteristics. Weighting mathematically adjusts the dataset so that the contribution of each respondent reflects their group's true proportion in the population.
The Step-by-Step Weighting Process
From Raw Data to Balanced Insights
Applying weights involves a systematic process:
1. Identify Key Weighting Variables
Researchers first decide which characteristics are most important for ensuring representativeness. These are often demographic variables for which reliable population data is available.
- Age group
- Gender
- Race or ethnicity
- Geographic region
- Education level
- Income bracket
2. Obtain Target Population Benchmarks
Accurate data on the target population's distribution for the chosen variables is crucial. This information typically comes from:
- National census data (e.g., U.S. Census Bureau)
- Large-scale government surveys
- Reliable demographic studies
These benchmarks provide the "true" proportions that the weighted survey sample should match.
3. Calculate the Weights
The basic principle involves comparing the sample proportion to the population proportion for each subgroup defined by the weighting variables. The fundamental formula for a simple weight (like in post-stratification) is:
\[ \text{Weight}_{\text{group}} = \frac{\text{Proportion of group in Target Population}}{\text{Proportion of group in Survey Sample}} \]For instance:
- If women constitute 51% of the target population but only 45% of the survey sample, the weight for female respondents would be \( \frac{0.51}{0.45} \approx 1.13 \).
- If individuals aged 65+ make up 20% of the population but 25% of the sample, their weight would be \( \frac{0.20}{0.25} = 0.80 \).
Respondents from underrepresented groups receive weights greater than 1, increasing their influence. Respondents from overrepresented groups receive weights less than 1, decreasing their influence. More complex methods like raking or propensity score modeling involve more sophisticated calculations but follow the same underlying principle.
4. Apply Weights to the Survey Data
Once calculated, the weights are typically added as a new variable in the survey dataset, with each respondent having an assigned weight value. During data analysis (e.g., calculating averages, percentages, totals), each respondent's answers are multiplied by their weight. Statistical software packages (like SPSS, R, SAS) and some survey platforms (like Qualtrics) have built-in functions to handle weighted data analysis.
5. Verify and Analyze
After applying weights, analysts often check if the weighted sample distributions match the target population benchmarks. They also compare key results between weighted and unweighted data to understand the impact of the adjustment. It's important to ensure weights aren't too extreme, as this can increase the variance (reduce the precision) of the survey estimates.
Common Weighting Methodologies
Choosing the Right Approach
Researchers employ various statistical techniques to calculate weights, depending on the available data, the number of weighting variables, and the complexity of the sample-population discrepancies.
Post-Stratification
This method involves dividing the sample into subgroups (strata) based on the weighting variables (e.g., young men, older women). Weights are calculated for each stratum using the basic formula described above. It's relatively straightforward but works best when dealing with only a few weighting variables and requires knowing the population size of each specific cross-classified cell.
Raking (Iterative Proportional Fitting)
Raking is one of the most widely used methods, especially when weighting by multiple variables simultaneously (e.g., age, gender, region). It iteratively adjusts weights so that the weighted sample totals match the population totals for each variable's categories (marginals) one at a time. The process repeats until the weights converge, meaning the weighted sample matches the population margins for all variables within a small tolerance. Raking only requires knowing the marginal population totals (e.g., total population by age group, total population by gender), not the specific size of combined subgroups (e.g., young men).
Propensity Score Weighting
This technique addresses non-response bias or situations where participation likelihood differs across groups (common in non-probability samples like online panels). It uses statistical models (like logistic regression or machine learning algorithms like random forests) to predict the probability (propensity score) of a person with certain characteristics being included in the sample. Weights are then typically calculated as the inverse of these propensity scores. Individuals with characteristics similar to those less likely to respond receive higher weights.
Matching
Matching aims to find respondents in a reference dataset (e.g., a large, high-quality survey or census data) that are similar to the survey respondents based on a set of variables. Weights are derived based on this matching process, often using similarity measures like the random forest similarity measure, which considers how many characteristics two cases share.
Regression Weighting
More sophisticated analyses might use regression models (like calibration weighting) to determine weights that ensure the weighted sample means or totals for auxiliary variables match known population values.
Comparing Weighting Methods
A Visual Overview
Different weighting methods have varying levels of complexity, data requirements, and potential accuracy. The radar chart below provides a comparative overview of three common methods based on several key factors. The scores are conceptual estimates (1=Low, 5=High) reflecting general tendencies.
Mapping the Concept of Survey Weighting
Understanding the Relationships
This mindmap illustrates the core concepts, purpose, process, and methods involved in survey response weighting.
Ensure Representativeness"] Bias_Types["Sampling Bias
Non-Response Bias
Coverage Error"] Goal["Match Sample to
Target Population"] Process["Weighting Steps"] Step1["Identify Weighting Variables
(e.g., Age, Gender, Region)"] Step2["Get Population Benchmarks
(e.g., Census Data)"] Step3["Calculate Weights
(Pop Proportion / Sample Proportion)"] Step4["Apply Weights to Data
(Weighted Analysis)"] Step5["Verify & Analyze
(Check Distributions, Impact)"] Methods["Weight Calculation Techniques"] Method1["Post-Stratification
(Simple Strata Weights)"] Method2["Raking
(Iterative Marginal Matching)"] Method3["Propensity Score Weighting
(Model Response Probability)"] Method4["Matching
(Pairing with Reference Data)"] Method5["Regression Weighting
(Calibration)"] Considerations["Important Factors"] Factor1["Data Quality
(Accurate Population Data)"] Factor2["Extreme Weights
(Can Increase Variance)"] Factor3["Software Tools
(SPSS, R, Qualtrics)"] Factor4["Impact on Statistics"]
A Different Kind of Weighting: Valuing Answer Choices
Assigning Importance to Specific Answers
It's important to note that "weighting responses" can sometimes refer to a different process: assigning numerical values (weights) to specific answer options within a question, often used in scales or matrices to calculate an overall score or average.
For example:
- Likert Scales: "Strongly Agree" might be weighted 5, "Agree" 4, "Neutral" 3, "Disagree" 2, and "Strongly Disagree" 1. Calculating the average score gives a measure of overall sentiment.
- Matrix Questions: In questions asking respondents to rate multiple items on the same scale, each scale point has an inherent weight.
- Importance Scores: Respondents might be asked to rate the importance of different factors, with higher importance ratings given more weight in subsequent analysis.
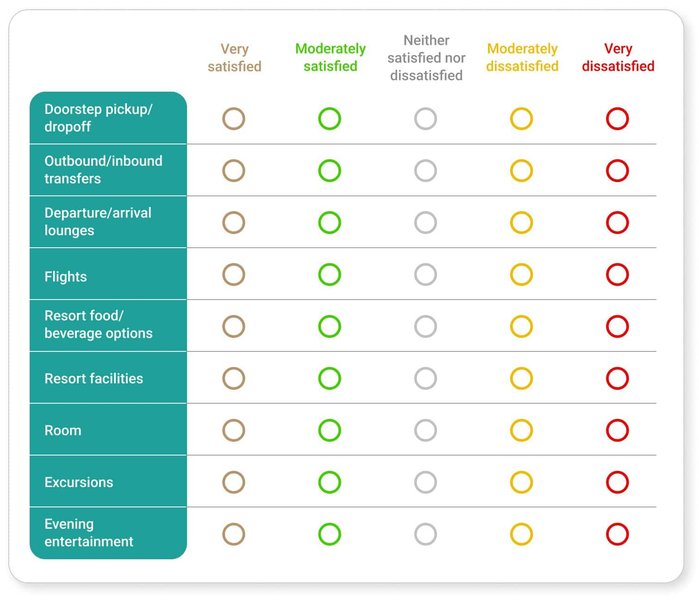
Example of a matrix question where scale points inherently carry weight.
This type of weighting is about interpreting the meaning or intensity of different answers within a question, whereas the primary topic discussed here (population weighting) is about adjusting the influence of different *respondents* to ensure the overall sample represents the population.
Weighting Methods at a Glance
Comparing Key Techniques
The following table summarizes the main characteristics, advantages, and disadvantages of the common population weighting methods discussed.
| Method | Description | Pros | Cons |
|---|---|---|---|
| Post-Stratification | Divides sample into strata based on weighting variables; calculates weights for each stratum based on population vs. sample proportion. | Conceptually simple; easy to implement with few variables. | Requires knowing population counts for specific cross-classified cells; can lead to unstable weights with many variables or small strata. |
| Raking (Iterative Proportional Fitting) | Iteratively adjusts weights to match known population marginal totals for multiple variables. | Widely used; handles multiple variables; only requires marginal population totals; generally robust. | Can be computationally intensive; convergence not always guaranteed; may produce extreme weights if margins are inconsistent. |
| Propensity Score Weighting | Uses statistical models to estimate probability of inclusion; weights are typically inverse of this probability. | Directly addresses non-response bias; useful for non-probability samples; can incorporate many covariates. | Requires careful model specification; relies on assumptions about the response mechanism; can be complex to implement correctly. |
| Matching | Pairs survey respondents with similar individuals in a reference population dataset; weights derived from matches. | Can effectively balance sample on many characteristics simultaneously if good reference data exists. | Heavily depends on the quality and completeness of the reference dataset; finding good matches can be difficult. |
Practical Considerations and Best Practices
Navigating the Nuances of Weighting
- Avoid Extreme Weights: Weights that are excessively large or small (e.g., outside a range like 0.3 to 3.0, though limits vary) can unduly influence results and increase the variance of estimates, making them less reliable. Techniques like weight trimming or capping may be used, but require careful justification.
- Impact on Statistics: Weighting typically has a larger impact on descriptive statistics (like percentages and means) than on analytical statistics like regression coefficients, although it can still influence model results.
- Software Implementation: Many statistical software packages (SPSS, SAS, R, Stata) and some survey platforms (like Qualtrics, SurveyMonkey) offer tools to calculate and apply weights.
- Transparency: It's crucial to document the weighting methodology, including the variables used, population benchmarks, and the specific technique applied, when reporting survey results.
- When Not to Weight: Weighting might not be necessary or appropriate if the sample already closely matches the population on key characteristics, or if the analysis focuses purely on relationships within the sample without generalizing to the population.
A Simple Calculation Example
Let's revisit the basic weight calculation:
- Target Population: 60% Female, 40% Male
- Survey Sample: 50% Female, 50% Male (out of 100 respondents, 50 Female, 50 Male)
Calculation:
- Weight for Females = Target Proportion / Sample Proportion = 0.60 / 0.50 = 1.2
- Weight for Males = Target Proportion / Sample Proportion = 0.40 / 0.50 = 0.8
In the weighted analysis, each female respondent effectively counts as 1.2 people, and each male respondent counts as 0.8 people. The total weighted count remains 100 (50 * 1.2 + 50 * 0.8 = 60 + 40 = 100), but the contributions are adjusted to match the population's gender distribution.
Frequently Asked Questions about Response Weighting
Why is survey weighting so important? +
Weighting is crucial because survey samples rarely perfectly represent the target population due to factors like sampling methods and non-response bias. Without weighting, results can be skewed, leading to inaccurate conclusions about the population's views or characteristics. Weighting adjusts the data to correct these imbalances, making the findings more accurate and generalizable.
What data do I need to perform weighting? +
You need two main things: 1) The relevant demographic (or other characteristic) information for each respondent in your survey sample (e.g., their age, gender, region). 2) Reliable, up-to-date data on the distribution of those same characteristics in your target population (population benchmarks), typically sourced from census data or large-scale government surveys.
Can weighting introduce bias? +
While weighting aims to reduce bias, it can potentially introduce bias if done improperly. This could happen if the population benchmarks used are inaccurate, the weighting variables chosen are inappropriate, or the weighting method itself makes incorrect assumptions. Extreme weights can also increase variance, reducing precision. Careful planning and validation are essential.
What's the difference between respondent weighting and answer weighting? +
Respondent weighting (population weighting) adjusts the influence of *entire respondents* to make the overall sample representative of the population demographics. Answer weighting assigns numerical values to *specific answer choices* within a question (e.g., 1-5 for a Likert scale) to reflect intensity or calculate scores, without necessarily adjusting for population representativeness.
When should I *not* weight my survey data? +
Weighting may not be necessary if your sample already closely matches your target population on key characteristics or if your research goal doesn't involve generalizing findings to the broader population (e.g., exploring relationships only within the specific sample). Sometimes, for specific analyses like certain types of modeling, unweighted data might be preferred, though this depends on the research question and assumptions.
Recommended Reading
- What are the most common sources for population benchmarks in survey weighting?
- How does raking compare to post-stratification in detail?
- Explain how propensity score weighting works for non-probability samples.
- What are the risks of using extreme weights in survey analysis?
References
Last updated April 30, 2025