
Unlock AI Trading Success: How to Rigorously Validate Ideas with Real-Time Data
Move beyond theory – learn the essential strategies to test, refine, and deploy AI-driven trading concepts in live markets.
Artificial intelligence (AI) is rapidly transforming the financial landscape, offering powerful tools for generating novel trading ideas and strategies. However, an idea generated by an AI, no matter how sophisticated, is only theoretical until proven effective in the unpredictable environment of live markets. Validating these AI-generated concepts using real-time data is not just recommended; it's a crucial step to mitigate risk, build confidence, and ultimately enhance profitability. This involves a systematic process of testing, monitoring, and refining strategies under current market conditions.
Key Validation Insights
Essential Takeaways for Robust AI Strategy Validation
- Backtesting is Foundational, Real-Time is Crucial: While testing against historical data (backtesting) provides a baseline, validating performance with live market data (forward testing/paper trading) is essential to gauge adaptability and real-world viability.
- Continuous Monitoring and Signal Verification: AI signals must be constantly checked against live data feeds, market indicators, and predefined conditions to ensure accuracy and relevance, filtering out noise and false positives.
- Integrated Risk Management is Non-Negotiable: Real-time data enables dynamic risk controls, such as adaptive stop-losses and position sizing, which are vital for protecting capital in volatile markets.
The Validation Framework: From History to Live Action
A Multi-Stage Approach to Testing AI Trading Ideas
Validating an AI-generated trading idea is a multi-layered process designed to build confidence and expose potential weaknesses before significant capital is committed. It typically progresses from historical simulations to live, real-time evaluations.
Phase 1: Historical Backtesting – Learning from the Past
Backtesting is the initial litmus test. It involves running the AI's proposed strategy against extensive historical market data to simulate how it would have performed in previous market cycles (bull, bear, sideways).
- Comprehensive Data: Utilize high-quality historical data covering various market conditions.
- Realistic Simulation: Incorporate factors like transaction costs (commissions, fees), slippage (difference between expected and execution price), and realistic order execution delays.
- Out-of-Sample Testing: Crucially, test the strategy on data segments that were not used during the AI model's training phase. This helps prevent "overfitting," where a model performs exceptionally well on past data but fails on new, unseen data.
- Walk-Forward Analysis: A more robust form of backtesting where the strategy is optimized on one period of historical data and then tested on the subsequent period, repeating this process across rolling time windows. This better simulates how a strategy would adapt over time.
While essential, backtesting only shows past potential. Market dynamics change, and past performance is not a guarantee of future results.
Phase 2: Forward Testing (Paper Trading) – Simulating the Present
Forward testing, often called paper trading, bridges the gap between historical simulation and live trading. The AI strategy is connected to real-time market data feeds, and trades are simulated without risking actual capital.
- Live Data Feed Integration: Connect the strategy to a reliable, low-latency real-time data source mirroring the live trading environment.
- Real-World Conditions: Observe how the strategy performs under current market volatility, liquidity constraints, and order book dynamics.
- Identify Nuances: This stage often reveals issues not apparent in backtesting, such as sensitivity to data feed latency or unexpected behaviour during news events.
- Adaptability Check: Assess how well the AI model adapts (or fails to adapt) its signals based on incoming live information.
Paper trading provides critical insights into the practical application of the AI strategy in the current market environment.
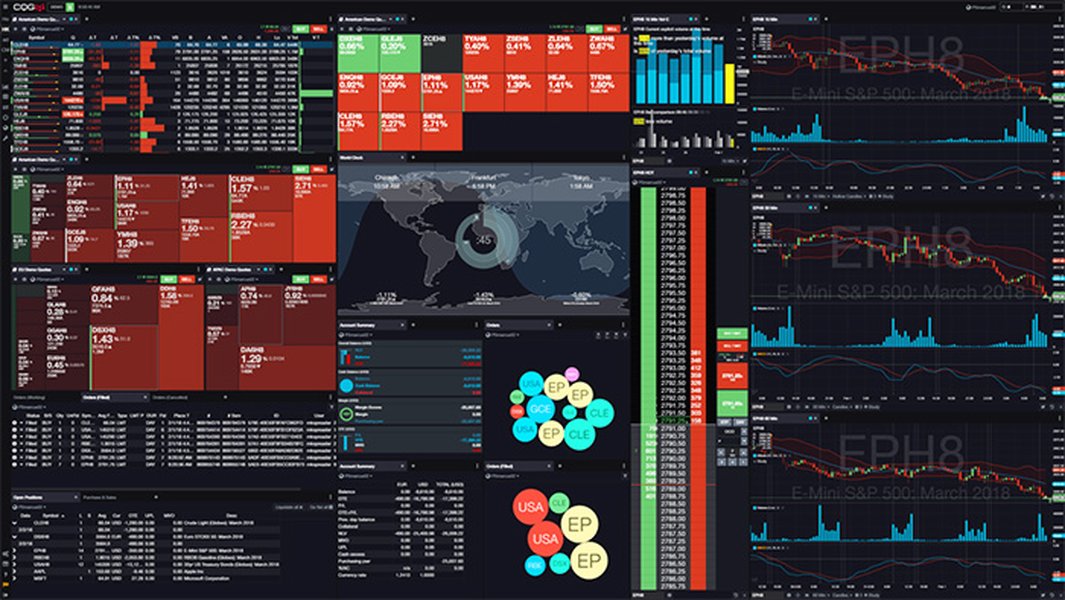
Real-time data visualization platforms are essential for monitoring market conditions and validating AI signals.
Real-Time Monitoring and Signal Integrity
Ensuring AI Signals Remain Accurate and Relevant
Once an AI strategy moves beyond initial testing, continuous monitoring using real-time data becomes paramount. This involves validating the signals generated by the AI *before* they lead to trade execution and tracking performance metrics dynamically.
Continuous Signal Validation
AI-generated signals (e.g., buy, sell, hold recommendations) must be constantly scrutinized against live market realities.
- Cross-Referencing: Compare the AI signal against other independent technical indicators, market sentiment data, news feeds, or even signals from different AI models (ensemble methods). Consistency across multiple sources increases confidence.
- Multi-Factor Confirmation: Ensure that all the conditions or criteria defined within the AI model for generating a signal are genuinely met based on the latest real-time data points.
- Contrarian and Confirmation Checks: Use techniques to identify if a signal aligns with the prevailing trend (confirmation) or goes against it (contrarian). This helps filter noise, especially in volatile conditions. Some platforms offer tools specifically for this type of classification.
- Anomaly Detection: Implement systems to detect unusual signal patterns or performance deviations that might indicate model drift (where the AI's effectiveness degrades over time) or issues with the data feed.
- Automated Alerts: Set up real-time alerts that trigger when an AI generates a signal, allowing for immediate review or verification, perhaps filtered by the AI's confidence score for that signal.
Leveraging Real-Time Analytics and Visualization
Tools that provide real-time analytics and visualization are invaluable for understanding the context behind AI signals.
- Live Dashboards: Monitor key metrics like price action, trading volume, order flow, volatility indices, and market sentiment indicators in real-time.
- Data Integrity: Ensure the quality, accuracy, and timeliness of the real-time data feeds being used. Erroneous data leads to flawed validation and poor trading decisions. Robust infrastructure is needed to handle high-velocity data streams.
- Performance Tracking: Continuously calculate and display key performance indicators (KPIs) based on live (or paper) trades generated by the strategy.
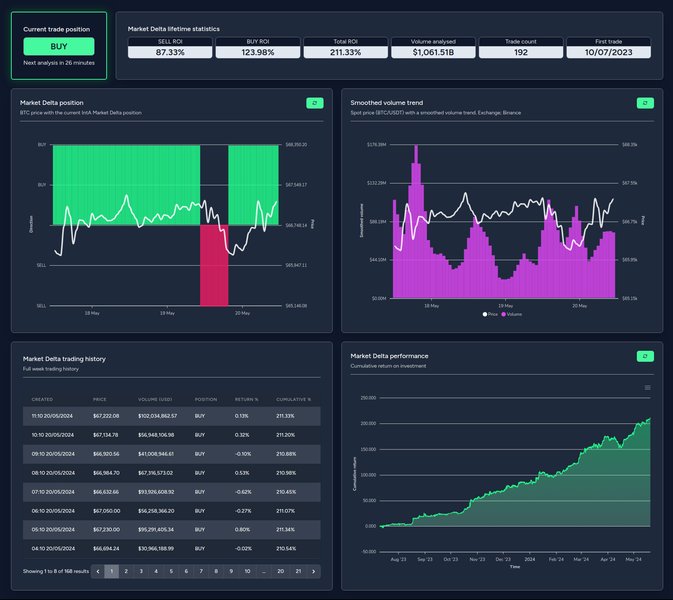
Advanced dashboards integrate various real-time data streams for comprehensive market analysis and strategy validation.
Real-Time Risk Management Integration
Protecting Capital with Dynamic Controls
Validation isn't just about potential profitability; it's critically about managing risk. Real-time data is essential for implementing dynamic risk controls that adapt to changing market conditions, protecting capital from unforeseen events or strategy failures.
Adaptive Risk Parameters
- Dynamic Position Sizing: Automatically adjust the size of trades based on real-time volatility metrics or the current drawdown level of the trading account. Higher volatility might warrant smaller positions.
- Intelligent Stop-Losses: Implement stop-loss orders that aren't static but adapt to real-time price action, such as trailing stops that follow profitable trades or volatility-adjusted stops.
- Profit Targets: Utilize dynamic profit targets that might adjust based on momentum or market conditions observed in real-time.
- Exposure Monitoring: Continuously track the overall portfolio exposure and concentration risk. Real-time data allows for immediate adjustments if risk limits are approached.
Stress Testing and Scenario Analysis
While not strictly real-time validation during trading, periodically use real-time data characteristics (like observed volatility spikes or liquidity drops) to simulate how the AI strategy might perform under extreme market stress (e.g., flash crashes, unexpected news events). This helps understand potential downside risks.
Automated Risk Overrides
Build in mechanisms where the system can automatically intervene if predefined risk thresholds are breached in real-time, regardless of the AI's signals. This could involve pausing trading, reducing position sizes, or hedging exposure.
Evaluating Strategy Effectiveness: Key Metrics in Real-Time
Quantifying Performance Beyond Backtesting
Consistent performance monitoring using quantifiable metrics is vital during the real-time validation phase (paper trading) and ongoing live trading. These metrics help objectively assess the AI strategy's effectiveness and compare its live performance against backtested expectations.
The following table outlines some crucial metrics used in evaluating trading strategies with real-time data:
| Metric | Purpose in Real-Time Validation | Interpretation |
|---|---|---|
| Win Rate (%) | Measures the percentage of trades closed profitably. | Compare live win rate to backtested win rate. Significant divergence may indicate strategy degradation or changing market conditions. |
| Profit Factor | Gross profits divided by gross losses. | A value greater than 1 indicates profitability. Monitor consistency over time. |
| Sharpe Ratio | Measures risk-adjusted return (excess return per unit of volatility). | Higher is generally better. Compare live Sharpe ratio to backtested results to see if risk-adjusted performance holds up. |
| Sortino Ratio | Similar to Sharpe, but only considers downside volatility (risk of losses). | Provides a clearer picture of risk specifically related to negative returns. |
| Maximum Drawdown (Max DD) | The largest peak-to-trough decline in portfolio value. | A key risk measure. Monitor if live drawdown exceeds backtested Max DD, potentially signaling increased risk. |
| Average Gain / Average Loss | The average profit on winning trades versus the average loss on losing trades. | Ideally, average gains should significantly outweigh average losses (related to Risk/Reward Ratio). |
| Slippage Analysis | Measures the difference between the expected execution price and the actual filled price. | High slippage in live trading can significantly erode profits compared to backtests where it might be underestimated. Requires real-time execution data. |
| Trade Frequency | How often the strategy generates trades. | Compare live frequency to backtested frequency. Changes might indicate shifts in market behaviour or issues with the AI model's signal generation. |
Continuously tracking these metrics provides objective feedback on the AI strategy's real-world performance and its alignment with initial expectations.
Visualizing Validation Priorities
Comparing Key Aspects Across AI Trading Approaches
Different AI trading strategies might prioritize validation aspects differently. For instance, a high-frequency strategy heavily relies on execution speed and data latency validation, while a long-term strategy might focus more on the robustness of the core predictive model over extended periods. The radar chart below provides a conceptual comparison of validation priorities for different hypothetical AI trading approaches. Note that these are illustrative weightings based on typical strategy characteristics, not hard data.
This chart illustrates how the focus of validation shifts. High-frequency strategies demand extreme attention to data latency and slippage, while pattern recognition models need rigorous backtesting and adaptability checks. Sentiment analysis relies heavily on verifying the quality and interpretation of real-time sentiment data feeds.
Structuring the Validation Process
A Mindmap Overview
The process of validating AI-generated trading ideas using real-time data can be visualized as a structured approach encompassing several key areas. The mindmap below outlines the core components and sub-strategies involved.
using Real-Time Data"] id1["Phase 1: Testing & Simulation"] id1a["Historical Backtesting"] id1a1["Extensive Data Sets"] id1a2["Realistic Costs/Slippage"] id1a3["Out-of-Sample Testing"] id1a4["Walk-Forward Analysis"] id1b["Forward Testing (Paper Trading)"] id1b1["Live Data Feed Integration"] id1b2["Current Market Conditions"] id1b3["Identify Execution Nuances"] id2["Phase 2: Real-Time Monitoring"] id2a["Continuous Signal Verification"] id2a1["Cross-Referencing (Indicators, News)"] id2a2["Multi-Factor Confirmation"] id2a3["Anomaly Detection"] id2a4["Automated Alerts"] id2b["Analytics & Visualization"] id2b1["Live Dashboards (Price, Vol, Flow)"] id2b2["Data Integrity Checks"] id2b3["Real-Time KPI Tracking"] id3["Phase 3: Risk Management"] id3a["Dynamic Risk Controls"] id3a1["Adaptive Position Sizing"] id3a2["Intelligent Stop-Losses"] id3a3["Exposure Monitoring"] id3b["Stress Testing"] id3c["Automated Overrides"] id4["Phase 4: Performance Evaluation"] id4a["Key Performance Metrics"] id4a1["Win Rate, Profit Factor"] id4a2["Sharpe/Sortino Ratios"] id4a3["Max Drawdown"] id4a4["Slippage Analysis"] id4b["Comparison: Live vs. Backtest"] id4c["Model Retraining/Recalibration Triggers"] id5["Supporting Elements"] id5a["Robust Infrastructure"] id5b["Quality Data Feeds"] id5c["AI Validation Tools/Platforms"] id5d["Ensemble Methods (Multiple Models)"]
This mindmap highlights the interconnected nature of the validation process, starting from initial testing and progressing through continuous real-time monitoring, risk control, and performance evaluation, all supported by robust infrastructure and tools.
Exploring AI Strategy Creation and Validation
Insights from Practical Application
Understanding how AI can be used to generate trading strategies provides context for why validation is so critical. The following video explores using AI tools like ChatGPT within platforms like TradingView to create day trading strategies. While focused on creation, the principles discussed inherently link to the need for subsequent validation using real-time data and robust backtesting, as covered in the strategies above. It demonstrates the accessibility of AI for idea generation but underscores the importance of not blindly trusting the output without rigorous testing.
Video exploring the use of AI tools to generate trading strategies, highlighting the practical side of AI application in trading.
Frequently Asked Questions (FAQ)
Common Queries on Validating AI Trading Ideas
What's the difference between backtesting and forward testing (paper trading)?
Backtesting uses historical data to simulate how a strategy would have performed in the past. It's useful for initial screening and identifying potential flaws but relies on past conditions.
Forward testing (paper trading) uses live, real-time market data to simulate trades without risking real money. It tests how the strategy performs under current market conditions, revealing issues related to latency, liquidity, and adaptability that historical data might miss.
How important is the quality of real-time data for validation?
Data quality is absolutely critical. Inaccurate, delayed, or incomplete real-time data will lead to flawed validation results and potentially disastrous trading decisions. For strategies sensitive to speed (like HFT), low-latency data is essential. Ensure your data provider is reliable and the data feed accurately reflects the market you intend to trade.
Can AI perfectly predict market movements?
No. AI, including machine learning models, cannot perfectly predict market movements. Markets are influenced by countless factors, including unpredictable human behavior and unforeseen global events. AI can identify complex patterns and probabilities based on data, potentially improving decision-making, but it does not eliminate risk or guarantee profits. Validation is crucial precisely because AI predictions are probabilistic, not certain.
What are common pitfalls when validating AI trading ideas?
- Overfitting: Creating an AI model that performs exceptionally well on historical data but fails on new data because it learned noise rather than genuine patterns. Use out-of-sample and forward testing to mitigate this.
- Ignoring Costs/Slippage: Underestimating the impact of transaction fees and execution price differences in backtesting, leading to overly optimistic results.
- Insufficient Data: Using too little historical data or poor-quality real-time data for validation.
- Confirmation Bias: Only looking for evidence that supports the AI idea while ignoring contradictory signals during validation.
- Lack of Adaptability: Deploying a strategy without mechanisms to monitor for model drift or adapt to changing market regimes.
Recommended Further Exploration
Dive Deeper into Related Topics
- How do you choose the best real-time data provider for algorithmic trading?
- What are the most effective techniques for preventing overfitting in AI trading models during backtesting?
- How do different AI and machine learning algorithms compare for stock market prediction tasks?
- What are the practical steps for implementing dynamic risk management systems in automated trading strategies?
References
Sources Used for This Analysis
Last updated May 5, 2025