
Unveiling the EU ETS 2005 Bedrock: The Emission Figures That Shape Climate Ambitions
Delving into the precise 2005 emission levels that underpin the European Union's pioneering carbon market and its reduction targets.
The European Union Emissions Trading System (EU ETS) stands as a cornerstone of the EU's climate policy, employing a "cap and trade" mechanism to reduce greenhouse gas emissions cost-effectively. A critical element of this system is its baseline emission level, established in its inaugural year, 2005. This figure serves as the benchmark against which subsequent emission reduction targets for covered sectors are measured.
Key Insights into the 2005 EU ETS Baseline
- Explicit 2005 Emission Level: The initial cap for stationary installations in the EU ETS Phase 1 (2005-2007) was approximately 2,096 million tonnes of \(\text{CO}_2\) equivalent (Mt\(\text{CO}_2\text{e}\)). This figure is the foundational baseline for EU ETS specific targets.
- Core Sectors Covered in 2005: The baseline primarily encompassed emissions from power and heat generation facilities (larger than 20 MW), oil refineries, coke ovens, iron and steel production, and manufacturers of cement, glass, ceramics, pulp, and paper.
- Foundation for Targets: This 2005 level is pivotal for calculating the trajectory of emissions reductions, most notably the EU ETS target of a 62% decrease in emissions by 2030 compared to these 2005 levels.
The 2005 EU ETS Baseline: A Closer Look
When the EU ETS was launched in 2005, it marked a significant step in global efforts to combat climate change. The system's effectiveness hinges on a clearly defined emissions cap that decreases over time. The baseline year, 2005, and the emissions level from that year are crucial for this framework.
The Definitive 2005 Emission Figure
The most consistently cited figure for the EU ETS initial cap, which effectively serves as the 2005 baseline for its specific targets, is approximately 2,096 million tonnes of \(\text{CO}_2\) equivalent (Mt\(\text{CO}_2\text{e}\)). This cap applied to the stationary installations within the sectors covered during the first trading period (Phase 1: 2005-2007).
It's important to distinguish this ETS-specific baseline and its targets (like the -62% by 2030 vs. 2005 for ETS sectors) from broader EU economy-wide climate targets. For instance, the EU's "Fit for 55" package aims for at least a 55% net reduction in economy-wide greenhouse gas emissions by 2030 compared to 1990 levels. Similarly, the recommended -90% net GHG reduction by 2040 is also benchmarked against 1990 levels for the entire EU economy. While the EU ETS contributes significantly to these overarching goals, its internal targets are specifically tied to its own 2005 baseline.
Sectors Forming the 2005 Baseline
The 2,096 Mt\(\text{CO}_2\text{e}\) baseline was derived from the emissions of specific energy-intensive sectors and activities. These primarily included:
- Power and Heat Generation: Electricity and heat production plants with a total rated thermal input exceeding 20 megawatts (MW).
- Oil Refineries: Mineral oil refineries.
- Coke Ovens.
- Metal Industries: Iron and steel production and processing (including metal ore roasting or sintering).
- Mineral Industries:
- Cement clinker production in rotary kilns.
- Lime production in rotary kilns.
- Manufacture of glass including glass fibre.
- Manufacture of ceramic products by firing, notably roofing tiles, bricks, refractory bricks, tiles, stoneware, or porcelain.
- Pulp and Paper Industries: Industrial plants for the production of pulp from timber or other fibrous materials, and the production of paper and board.
Aviation was incorporated into the EU ETS later (from 2012), and maritime transport more recently (from 2024). Therefore, the original 2005 baseline predominantly reflects emissions from these stationary industrial and energy installations.
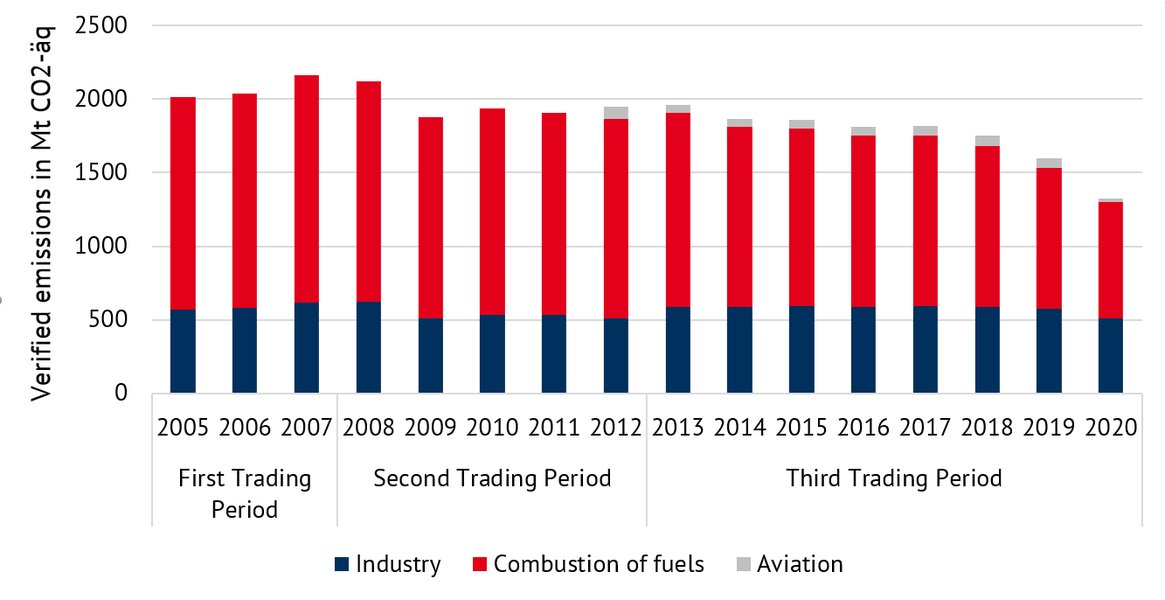
A visual representation of the EU ETS emissions cap and verified emissions, illustrating the system's trajectory.
How the 2005 Baseline Shapes EU ETS Targets
The 2005 emission level is not merely a historical data point; it is an active component in the EU ETS's operational mechanism, particularly in setting and tracking emission reduction targets. The system operates on a "cap and trade" principle, where an overall limit (cap) is set on the total amount of certain greenhouse gases that can be emitted by installations covered by the system. This cap is reduced over time so that total emissions fall.
The Linear Reduction Factor (LRF)
The primary tool for ensuring emissions decline is the Linear Reduction Factor (LRF). The LRF dictates the annual rate at which the emissions cap is reduced. This factor is applied to the baseline emissions to determine the cap for each subsequent year.
- In Phase 3 (2013-2020), the LRF was 1.74% annually, leading to a 21% reduction by 2020 compared to 2005 levels.
- For Phase 4 (2021-2030), and as part of increased climate ambition, the LRF was significantly strengthened. It increased to 2.2% initially and has been revised upwards. The LRF is set at 4.3% for the years 2024-2027 and will be 4.4% from 2028 onwards. This steepened trajectory is designed to achieve the target of a 62% reduction in EU ETS sector emissions by 2030, compared to 2005 levels.
Phased Approach and Achievements
The EU ETS has evolved through several phases:
- Phase 1 (2005-2007): The "learning by doing" phase, establishing the infrastructure and the initial cap of approximately 2,096 Mt\(\text{CO}_2\text{e}\).
- Phase 2 (2008-2012): Aligned with the first Kyoto Protocol commitment period, with a slightly reduced cap.
- Phase 3 (2013-2020): Introduced an EU-wide cap and auctioning as the main allocation method. Achieved significant emission reductions.
- Phase 4 (2021-2030): Features a more ambitious LRF, the inclusion of maritime transport (from 2024), and the establishment of a separate ETS (ETS2) for buildings, road transport, and additional sectors (starting 2027, with its own baseline and targets).
By 2023, emissions from sectors covered by the EU ETS had already fallen by approximately 47% compared to 2005 levels. Data reported by March 2025 indicated that EU ETS emissions in 2024 were around 50% below 2005 levels, demonstrating the system's impact on decarbonization efforts.
Summary of Key 2005 Baseline Information
The following table encapsulates the core details regarding the 2005 EU ETS baseline:
| Aspect | Detail |
|---|---|
| Baseline Year for EU ETS Targets | 2005 |
| 2005 Emission Level (EU ETS Phase 1 Cap) | Approximately 2,096 million tonnes of \(\text{CO}_2\text{e}\) (Mt\(\text{CO}_2\text{e}\)) for covered stationary installations. |
| Key Sectors in 2005 Baseline | Power and heat generation, oil refineries, coke ovens, iron and steel, cement, glass, ceramics, pulp and paper. |
| Primary EU ETS Target (based on 2005 levels) | 62% reduction in emissions from EU ETS sectors by 2030 compared to 2005 levels. |
| Role of Baseline | Serves as the starting point for setting the declining emissions cap and measuring progress towards reduction targets via the Linear Reduction Factor (LRF). |
Visualizing EU ETS Development and Key Parameters
To better understand the evolution and multifaceted nature of the EU ETS, a radar chart can illustrate key performance aspects across its different phases. This chart provides a conceptual overview rather than precise data points.
This chart conceptualizes aspects like the refinement of baseline calculations over time, the expansion of sectors covered, the increasing ambition of reduction targets, the pace of actual emission cuts, the system's adaptability (e.g., Market Stability Reserve), and its potential for further development (e.g., integration with ETS2, inclusion of more sectors).
Mapping the EU ETS Framework and its 2005 Baseline
A mindmap can help visualize the interconnected components of the EU ETS, with a focus on the significance of the 2005 baseline and its role in driving climate action.
(Steel, Cement, Refineries, Chemicals, Paper, Glass, Ceramics)"] id5["Evolution & Key Phases"] id5a["Phase 1 (2005-2007): Establishment"] id5b["Phase 2 (2008-2012): Kyoto Alignment"] id5c["Phase 3 (2013-2020): Centralized Cap"] id5d["Phase 4 (2021-2030): Enhanced Ambition"] id6["Key ETS Target (vs 2005)"] id6a["-62% by 2030 for ETS sectors"] id7["System Expansion"] id7a["Aviation (from 2012)"] id7b["Maritime Transport (from 2024)"] id7c["ETS2 (from 2027)
Buildings, Road Transport, Small Industry"]
This mindmap highlights how the 2005 baseline is a central pillar, influencing the cap, the reduction targets, and the overall architecture of the EU ETS as it has evolved and expanded to tackle a wider range of emissions sources.
Understanding the EU ETS: A Visual Explanation
The EU Emissions Trading System is a complex but vital tool in the European Union's climate action strategy. The following video provides a clear explanation of how the system works, its objectives, and its impact on reducing greenhouse gas emissions. Understanding its mechanics helps to appreciate the role of the 2005 baseline and the targets derived from it.
This video, "The EU Emissions Trading System explained," offers a foundational overview of the EU ETS, making it easier to grasp how the cap set in 2005 and the subsequent reduction targets contribute to the EU's broader environmental goals. It often covers the 'cap and trade' principle, the allocation of allowances, and the system's role in driving decarbonisation across key industries.
Frequently Asked Questions (FAQ)
What was the explicit 2005 emission level used as a baseline for the EU ETS?
The initial emissions cap for stationary installations in the EU ETS Phase 1 (2005-2007), which serves as the explicit 2005 baseline for its specific targets, was approximately 2,096 million tonnes of \(\text{CO}_2\) equivalent (Mt\(\text{CO}_2\text{e}\)).
Which sectors were primarily included in this 2005 EU ETS baseline?
The 2005 baseline primarily covered emissions from:
- Power and heat generation plants (above 20 MW thermal input)
- Oil refineries
- Coke ovens
- Iron and steel production facilities
- Cement clinker production
- Lime production
- Glass manufacturing
- Ceramics manufacturing
- Pulp and paper production
How is the 2005 baseline used to set EU ETS emission reduction targets?
The 2005 baseline is the starting point from which the overall emissions cap for the EU ETS is progressively reduced. This reduction is mandated by the Linear Reduction Factor (LRF), which specifies the annual percentage decrease in the cap. Targets, such as the 62% reduction by 2030, are expressed as a percentage decrease relative to this 2005 emissions level.
What is the main EU ETS emissions reduction target for 2030 based on 2005 levels?
The primary target for the sectors covered by the EU ETS is to reduce emissions by 62% by 2030 compared to their 2005 levels. This is a more ambitious target than previous phases and reflects the EU's increased climate commitments.
Is the EU's overall -55% emissions reduction target by 2030 calculated from the 2005 EU ETS baseline?
No, the EU's economy-wide target of at least a 55% net reduction in greenhouse gas emissions by 2030 is calculated relative to 1990 levels, not the 2005 EU ETS baseline. The EU ETS, with its own target of -62% by 2030 compared to 2005 levels for its covered sectors, is a key policy instrument that contributes significantly to achieving this broader EU-wide goal.
Recommended Further Exploration
- How does the EU ETS Linear Reduction Factor work to achieve climate targets?
- What are the differences between EU ETS1 and the new ETS2 for buildings and transport?
- What impact has the inclusion of maritime transport had on the EU ETS cap?
- How does the Market Stability Reserve function within the EU ETS?
References
Last updated May 13, 2025