
Unpacking the Aggregated Entity Resource Tool (2018): Analytics, Alerts, and Foresight
Exploring the data analysis, notification, and predictive capabilities embedded within this innovative tool.
The Aggregated Entity Resource Tool, subject of patent filings around 2018, represents a significant step in integrating various data management functionalities. Based on available patent information and analyses, this tool does indeed incorporate features related to data analytics, notifications, and predictive analytics, designed primarily to streamline operations and decision-making for users, potentially including small businesses.
Key Capabilities at a Glance
- Data Aggregation & Analytics: The tool excels at extracting and consolidating data from diverse sources, presenting it via customizable dashboards for insightful analysis of resource flows, user interactions, and inventory.
- Integrated Notification System: It features monitoring and alert mechanisms triggered by specific conditions (e.g., low inventory, data anomalies), enabling timely responses to operational changes.
- Foundation for Predictive Insights: While primarily focused on aggregation and real-time monitoring, the tool leverages historical and current data, providing the capability to forecast future trends, resource needs, and user behaviors for better planning.
Deep Dive into the Tool's Features
Harnessing the Power of Data Analytics
Centralizing Information for Clarity
A core function of the Aggregated Entity Resource Tool is its ability to perform robust data analytics. It achieves this by first aggregating data from multiple, potentially disparate, sources. Patent descriptions (like US20180374011A1 and US20180075385A1) highlight its capability to extract information concerning resource flows, interactions with outside entities (users, customers, suppliers), and inventory levels. This aggregation simplifies the complex landscape of business data into a unified view.
Customizable Dashboards for Actionable Insights
Once aggregated, the data is processed and presented through customizable dashboards. These dashboards are not merely static displays; they are dynamic interfaces leveraging data analytics techniques to reveal patterns, trends, and correlations within the operational data. Users can monitor resource utilization, track user engagement across different platforms, and oversee inventory in real-time. This analytical presentation transforms raw data into strategic insights, enabling more informed and timely decision-making for managing business resources and operations effectively.
Staying Informed with Real-Time Notifications
Proactive Monitoring and Alerts
Complementing its analytical capabilities, the tool incorporates a sophisticated notification system. This system actively monitors the aggregated data streams for predefined conditions or anomalies. For instance, alerts can be configured to trigger when inventory levels fall below a certain threshold, when unusual patterns emerge in user interactions, or when specific benchmarks in resource usage are met.
Enabling Rapid Response
These notifications are crucial for operational responsiveness. By alerting users to critical changes or potential issues—such as resource shortages, invoicing discrepancies, or unexpected shifts in demand—the tool ensures that businesses can react promptly. This proactive approach helps mitigate risks, address problems before they escalate, and maintain smoother operational workflows. The alerts are often integrated directly into the dashboard functionality, providing context alongside the notification.
Looking Ahead: Predictive Analytics Capabilities
Leveraging Past Data for Future Foresight
While data aggregation and real-time monitoring form its primary focus, the Aggregated Entity Resource Tool possesses the foundational architecture and utilizes data in ways that enable predictive analytics. By analyzing historical data patterns alongside current trends, the tool can generate forecasts about future events. This involves identifying recurring cycles, growth trajectories, and correlations that suggest likely future outcomes.
Applications in Planning and Resource Management
Predictive insights derived from the tool can be invaluable for strategic planning. For example, analyzing past resource request data might reveal seasonal spikes in demand. Predictive analytics can then forecast these future demands, allowing businesses to optimize resource allocation, manage inventory proactively, and anticipate user behavior or market shifts. This capability transforms the tool from a reactive monitoring system into a proactive planning asset, enhancing efficiency and strategic alignment. The ongoing evolution of AI and machine learning techniques in analytics suggests potential for even more sophisticated predictive features to be built upon this foundation.
Visualizing the Tool's Feature Emphasis
The following chart illustrates the relative emphasis and development stage of the core features within the Aggregated Entity Resource Tool, based on interpretations of the patent descriptions. Data Aggregation and Real-time Monitoring appear as core, well-defined functions, while Predictive Analytics is present but perhaps more as a foundational capability or an area for future expansion.
Mapping the Tool's Ecosystem
This mindmap provides a conceptual overview of the Aggregated Entity Resource Tool's structure, highlighting the interplay between its core components and functionalities.
Feature Applications in Practice
The following table summarizes how the core features of the Aggregated Entity Resource Tool translate into practical applications for users:
| Feature | Description | Example Application |
|---|---|---|
| Data Aggregation | Consolidates data from various sources (e.g., sales platforms, inventory systems, user logs). | Combining sales data from an online store and a physical location into one dataset for unified analysis. |
| Data Analytics | Processes aggregated data to identify trends, patterns, and key metrics. | Analyzing user interaction data across platforms to understand engagement patterns and popular features. |
| Customizable Dashboards | Visualizes key data points and analytics results in an easy-to-understand format. | Displaying real-time inventory levels, resource consumption rates, and outstanding invoices on a single screen. |
| Notifications & Alerts | Provides timely warnings based on predefined triggers or detected anomalies. | Sending an alert when inventory for a critical component drops below a safety threshold. |
| Predictive Analytics | Uses historical data to forecast future trends, demands, or behaviors. | Forecasting seasonal demand for specific resources based on the previous years' usage patterns to optimize procurement. |
Visualizing Analytics and Dashboards
The Aggregated Entity Resource Tool relies heavily on visualizing data through dashboards to make complex information accessible. While specific images of the tool itself aren't available, these examples illustrate the types of visualizations commonly used in data analytics and predictive modeling platforms, similar to what the tool likely provides.
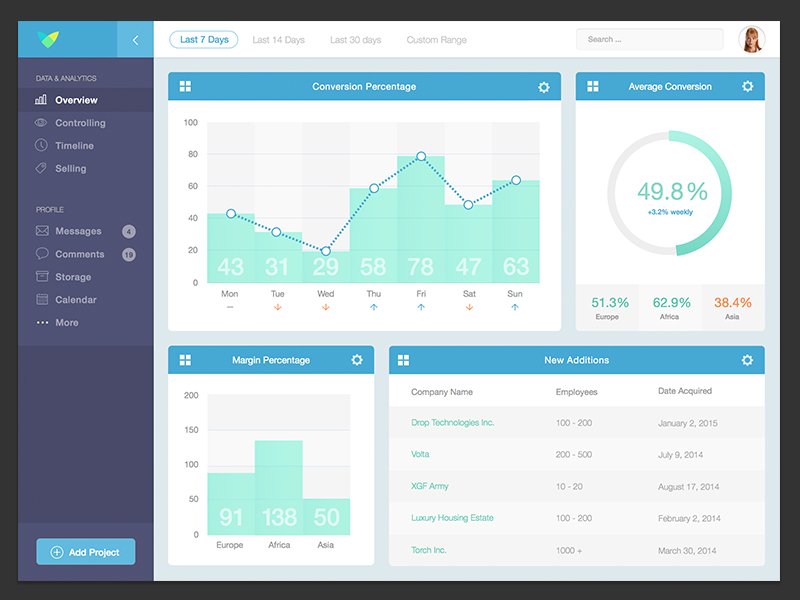
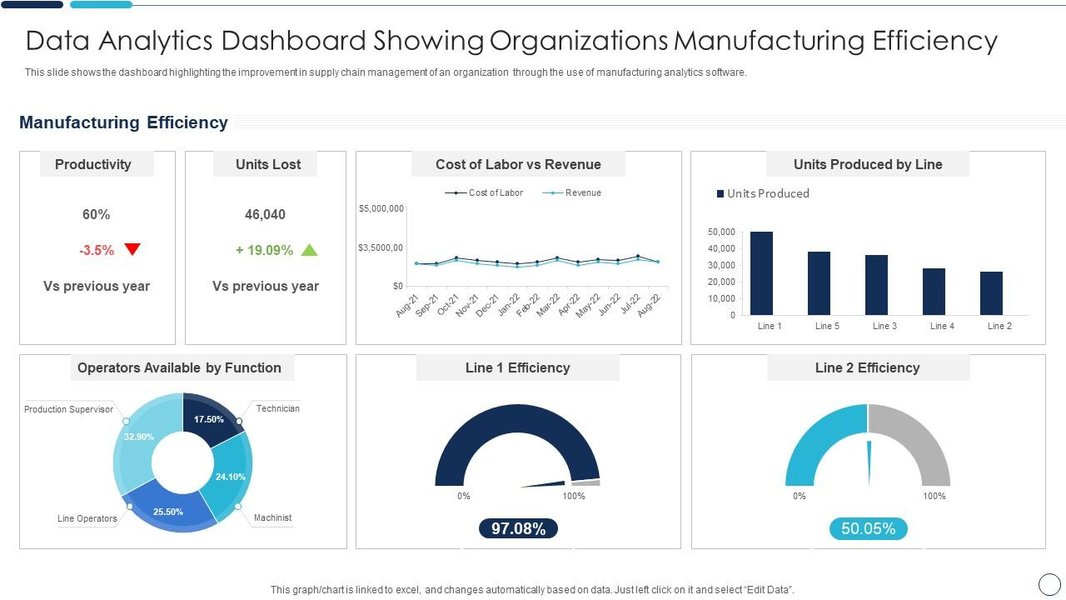
Examples of data analytics dashboards visualizing key metrics.
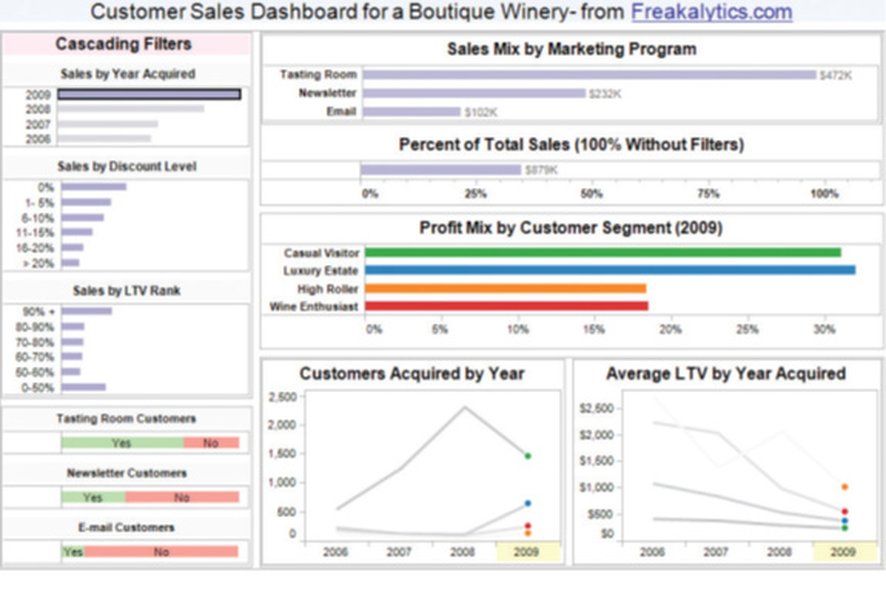
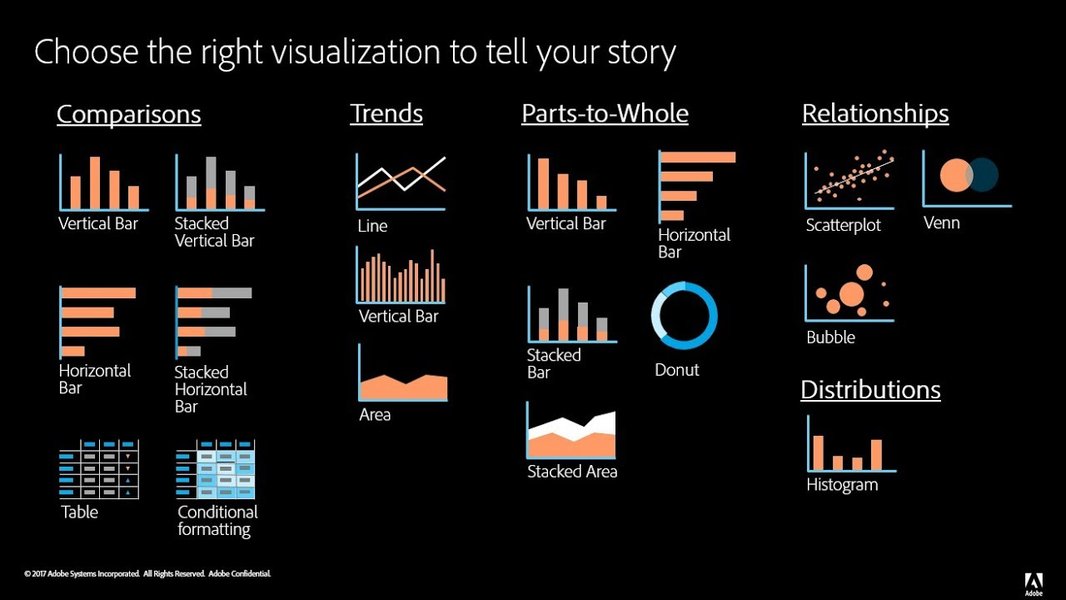
Visualizations used in predictive analytics and data exploration.
Understanding Predictive Analytics
Predictive analytics, a key potential feature of the Aggregated Entity Resource Tool, involves using data to make informed guesses about the future. This video provides a good overview of how businesses leverage past data to anticipate future trends and make better decisions, aligning with the goals of the tool.
This video explains the core concepts of predictive analytics and its business applications.
Frequently Asked Questions (FAQ)
What is the main purpose of the Aggregated Entity Resource Tool?
Where does the tool get its data from?
How does the predictive analytics feature differ from basic monitoring?
Is this tool widely available?
References
- US20180374011A1 - Aggregated entity resource tool - Google Patents
- US20180075385A1 - Aggregated entity resource tool - Google Patents
- US 10,657,478 B2 - Aggregated entity resource tool | RPX Insight
- Predictive Analytics: Definition, Model Types, and Uses - Investopedia
- What Is Data Aggregation? Definition, Importance & How it Works - Datamation
- What is Predictive Analytics? How it Works, Benefits & Uses - ServiceNow
- What Is Predictive Analytics? 6 Examples - HBS Online
Recommended
Last updated April 5, 2025