
Rising Waters: Could Climate Change Submerge Harvard?
Exploring the threshold of sea level rise needed to inundate the historic university campus.
Harvard University, nestled in Cambridge, Massachusetts, sits near the banks of the Charles River, placing it in a region increasingly vulnerable to the effects of climate change, particularly sea level rise. Determining the precise amount of sea level rise required to put Harvard "underwater" involves understanding its elevation, the complex dynamics of coastal and riverine flooding, and future climate projections.
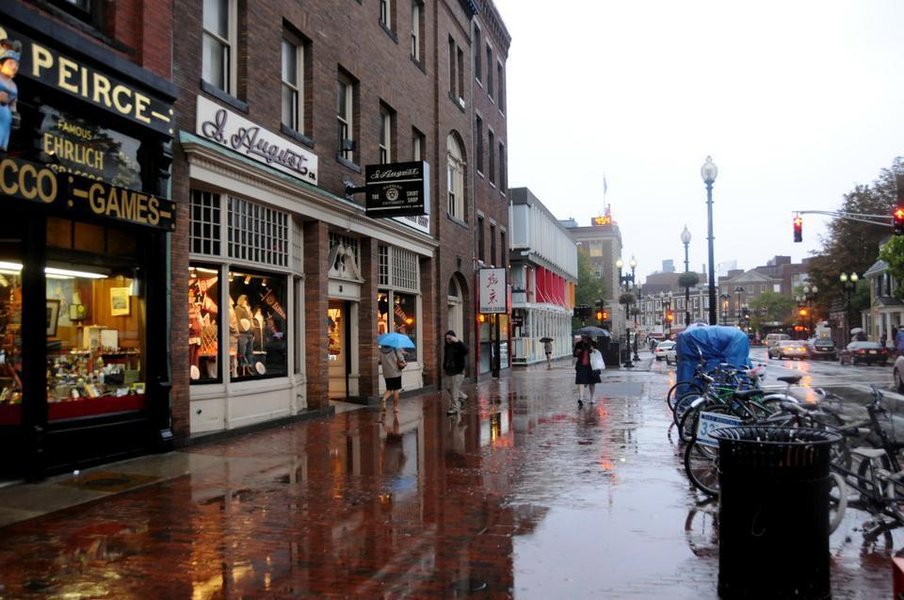 Harvard University's iconic architecture stands near areas potentially vulnerable to future flooding.
Highlights: Key Factors Determining Harvard's Flood Risk
- Elevation Variability: While parts of Harvard Yard sit 10-20 feet above sea level, areas closer to the Charles River, including River Houses and athletic fields, are significantly lower and more susceptible to initial flooding.
- Accelerating Sea Level Rise: Global sea levels are rising at an increasing rate due to melting ice sheets and thermal expansion, with projections for the U.S. East Coast indicating potentially significant increases this century.
- Compounding Local Factors: Land subsidence (sinking) along the East Coast, combined with the temporary but powerful effects of storm surges and high tides, significantly amplifies the local flood risk beyond baseline sea level rise alone.
Understanding Harvard's Position: Elevation and Proximity
Where Does Harvard Stand Relative to Sea Level?
Harvard University's main campus, including the historic Harvard Yard, generally sits at an elevation of approximately 10 to 20 feet (about 3 to 6 meters) above current mean sea level. However, this elevation is not uniform across the entire university area. Crucially, significant parts of the campus, particularly those adjacent to the Charles River like the undergraduate River Houses and athletic facilities, are situated at considerably lower elevations.
Vulnerability Near the Water
These lower-lying areas are naturally more susceptible to flooding. Even today, high tides combined with storm events can lead to localized flooding near the river. As sea levels rise, the frequency and severity of such events are expected to increase, pushing floodwaters further inland and potentially impacting these vulnerable parts of the campus first.
 Coastal flooding events, like this one in the Boston area, demonstrate the existing vulnerability that sea level rise will exacerbate.
Projecting the Future: How High Will the Waters Rise?
Global Trends and Local Impacts
Climate change is driving global sea level rise through two primary mechanisms: the thermal expansion of warming ocean water and the melting of glaciers and ice sheets. Authoritative bodies like the Intergovernmental Panel on Climate Change (IPCC), NASA, and NOAA provide projections based on different greenhouse gas emission scenarios.
Global average sea level has already risen significantly, and the rate of rise is accelerating. For the U.S. East Coast, including the Boston area where Harvard is located, projections often exceed the global average due to factors like ocean currents and land subsidence.
Short-Term and Long-Term Projections
Specific projections for the Boston region suggest:
- Near-term (e.g., by 2030): Increases of around 8 inches (relative to land) compared to 2016 levels are anticipated.
- Mid-century (e.g., by 2050): Significant increases in high-tide flooding frequency are expected. Projections suggest levels could reach approximately 1 meter (3.3 feet) higher than present under certain scenarios.
- End-of-century (e.g., by 2100): Projections vary widely based on emissions pathways. "Likely" ranges often fall between 0.43 to 0.84 meters globally, but regional projections for Boston could reach 1.2 meters (around 4 feet) or potentially much higher (2 meters / 6.6 feet or more) in higher-emission or accelerated ice-melt scenarios. Extreme scenarios considering rapid Antarctic ice sheet melt suggest even higher possibilities, though with lower probability.
The Amplifying Effect of Land Subsidence
A critical factor for the U.S. East Coast is land subsidence – the gradual sinking of the landmass. Research, including studies involving Harvard scientists, has highlighted that the land along the coast is sinking due to geological processes (glacial isostatic adjustment) and potentially human activities like groundwater extraction. This subsidence effectively adds to the relative sea level rise experienced locally, meaning that the water level rises faster relative to the land than the global average sea level rise alone would suggest. This makes areas like Cambridge even more vulnerable.
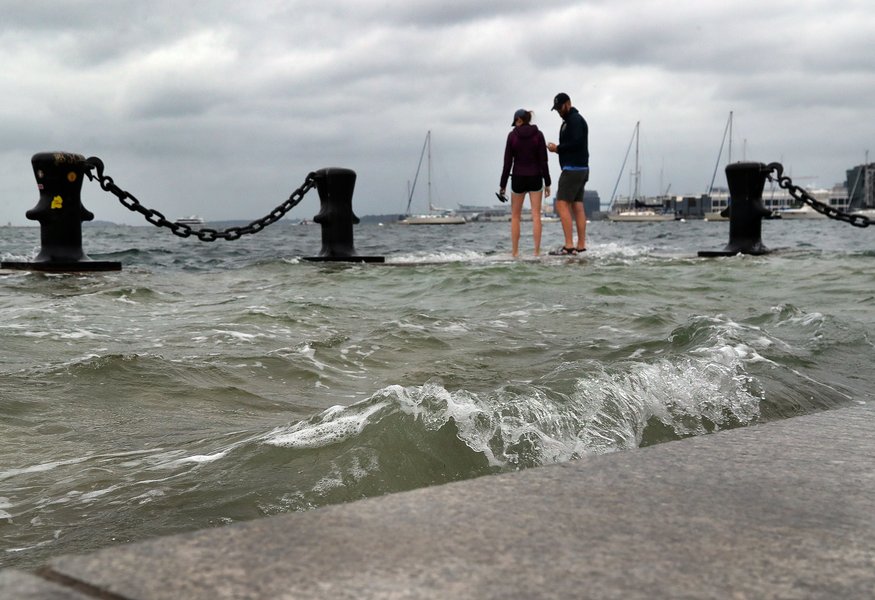 Cities like Boston are actively planning and implementing coastal defense strategies to mitigate future flooding risks.
Assessing Flood Risk Factors for Harvard
A Multi-Factor Vulnerability Analysis
Harvard's vulnerability to flooding from sea level rise isn't determined by a single factor. It's a complex interplay of global sea level changes, local land movement, proximity to waterways, campus topography, and the intensity of weather events. The following chart visualizes the relative contribution of these key factors to the overall flood risk profile for the university.
This visualization underscores that factors like proximity to the river and local subsidence significantly elevate Harvard's risk profile beyond just considering global average sea level rise. Storm surges, while temporary, pose a major threat by drastically increasing water levels during specific events.
Synthesizing the Data: When Does Harvard Flood?
Estimating Inundation Thresholds
Based on current elevations and projected sea level rise, we can estimate the potential impacts:
- Frequent Nuisance Flooding (Lower Areas): With a sea level rise of around 0.5 to 1 meter (1.6 to 3.3 feet), combined with high tides or minor storm surges, low-lying parts of the campus near the Charles River (River Houses, athletic fields) would likely experience increasingly frequent, disruptive flooding. This aligns with projections suggesting chronic high-tide flooding could become common along the East Coast in the coming decades (starting potentially in the 2030s/2040s).
- Significant Campus Inundation (Main Yard): For substantial portions of the main Harvard Yard (average elevation 10-20 feet) to be underwater regularly, a more significant sea level rise would be required. A rise of 2 meters (6.6 feet) or more could lead to more severe and persistent inundation, especially when combined with storm events.
- Widespread Submersion: To put the majority of the main campus, including Harvard Yard, consistently "underwater" purely from baseline sea level rise (without storm surge), levels would likely need to reach closer to 3 to 5 meters (approximately 10 to 16 feet) above current levels, considering the higher elevations within the Yard. However, functional disruption and significant damage would occur long before this level is reached due to intermittent flooding and impacts on infrastructure.
It is crucial to differentiate between intermittent flooding during high tides/storms and permanent inundation. The former will become increasingly common with smaller amounts of sea level rise, impacting accessibility and infrastructure long before the campus is permanently submerged.
Visualizing the Connections: Factors Driving Flood Risk
The mindmap below illustrates the interconnected factors contributing to the potential flooding of Harvard University due to climate change-induced sea level rise.
(Variable: 10-20ft+ avg, lower near river)"] id2b["Land Subsidence
(East Coast phenomenon)"] id2c["Existing Infrastructure"] id3["Climate Change Drivers"] id3a["Global Sea Level Rise"] id3a1["Thermal Expansion"] id3a2["Melting Ice Sheets
(Greenland, Antarctica)"] id3a3["Melting Glaciers"] id3b["Increased Storm Intensity/Frequency"] id3c["Changes in Ocean Currents"] id4["Sea Level Rise Projections (Boston Area)"] id4a["Short-Term (~2030): ~8 inches"] id4b["Mid-Century (~2050): ~1 meter potential"] id4c["End-of-Century (~2100): 1.2 - 2+ meters possible"] id5["Potential Impacts"] id5a["Increased Tidal Flooding
(Lower areas, River Houses)"] id5b["Storm Surge Inundation"] id5c["Infrastructure Damage"] id5d["Campus Accessibility Issues"] id5e["Potential for Wider Campus Flooding
(at higher SLR levels)"] id6["Mitigation & Adaptation"] id6a["University Planning"] id6b["City/Regional Flood Defenses"] id6c["Building Retrofits"]
This map highlights how global climate phenomena translate into specific local risks for Harvard, mediated by geographical and geological factors, and ultimately leading to tangible impacts that necessitate adaptation strategies.
Sea Level Rise Scenarios and Potential Impacts on Harvard
A Summary Table of Potential Effects
The following table summarizes the potential impacts on different parts of the Harvard campus under various sea level rise scenarios. These impacts would be significantly worsened during storm surges or extreme high tides.
| Sea Level Rise (above current) | Impact on River Houses & Low-Lying Areas near Charles River | Impact on Lower Elevation Parts of Main Campus | Impact on Harvard Yard (Higher Elevation Areas) |
|---|---|---|---|
| 0.5 meters (1.6 feet) | Increased frequency of nuisance flooding, especially during high tides and minor storms. Potential basement flooding. | Minimal direct impact from sea level alone, but increased risk during significant storms. | No direct impact from sea level alone. |
| 1.0 meter (3.3 feet) | Regular tidal flooding likely. Significant disruption and potential damage without adaptation. Access issues probable. | Potential for occasional flooding during high tides and moderate storms. Some infrastructure stress. | Minimal direct impact, but surrounding areas affected. |
| 2.0 meters (6.6 feet) | Persistent inundation likely. Major damage and potential unusability without significant defenses. | Regular flooding likely, especially during high tides/storms. Significant infrastructure damage probable. | Potential for flooding in lowest points during major storm surges. Increased water table issues. |
| 3.0 meters (9.8 feet) | Largely submerged. | Widespread and frequent/persistent flooding likely. | Significant portions potentially inundated, especially during storms. Major campus disruption. |
| 5.0 meters (16.4 feet) | Completely submerged. | Most areas likely submerged or frequently inundated. | Significant portions likely submerged or regularly flooded. Campus fundamentally altered. |
Note: This table provides simplified estimates. Actual impacts depend on precise topography, storm characteristics, river flow, and implemented flood defenses.
Insights from Harvard Researchers
Understanding the Science of Sea Level Rise
Researchers at Harvard University are actively contributing to the understanding of climate change and sea level rise. The following video features Harvard professors discussing the complexities of melting ice sheets and the factors contributing to rising sea levels globally and regionally.
This discussion highlights the scientific basis for the projections discussed earlier, emphasizing the role of melting Greenland ice sheets (studied by Prof. Straneo) and the complex "fingerprints" that determine regional sea level changes (studied by Prof. Mitrovica). Understanding these dynamics is crucial for accurately assessing risks for coastal locations like Cambridge and planning effective responses.
Frequently Asked Questions (FAQ)
What parts of Harvard are most vulnerable to flooding?
Areas at lower elevations and closest to the Charles River are the most vulnerable. This includes the undergraduate River Houses (like Dunster, Mather, Leverett, Winthrop, Eliot, Kirkland), athletic facilities (like Soldiers Field), and potentially some graduate school buildings situated nearer to the river or in lower-lying parts of Cambridge. Harvard Yard itself is generally higher but not immune to extreme events or rising groundwater levels.
Is Harvard University taking action to address flood risk?
Yes, like many institutions and municipalities in coastal areas, Harvard is aware of the risks and engages in planning and research related to climate change adaptation. This includes studying vulnerabilities, assessing infrastructure, potentially incorporating resilience measures into new construction and renovations, and collaborating with the City of Cambridge and Boston on broader regional strategies. Specific flood protection measures for individual buildings or areas may be implemented as risks become more imminent.
How exactly does land subsidence worsen flood risk?
Land subsidence means the land itself is sinking relative to the center of the Earth. When this happens in a coastal area, it has the same effect as sea level rising faster. If the sea level rises by 1 inch globally, but the land sinks by 1 inch, the *relative* sea level rise experienced at that location is 2 inches. This means flooding thresholds are reached sooner and impacts are more severe than they would be from global sea level rise alone. The U.S. East Coast experiences subsidence largely due to the land still adjusting after the melting of ancient ice sheets (glacial isostatic adjustment).
What is the difference between sea level rise and storm surge?
Sea level rise is the long-term increase in the average height of the ocean surface, primarily caused by climate change (thermal expansion and melting ice). It's a gradual process measured over years and decades. Storm surge, on the other hand, is a temporary and localized rise in sea level caused by a storm's high winds pushing water towards the shore and low atmospheric pressure allowing the sea surface to bulge upwards. While sea level rise sets a higher baseline, storm surge adds significantly to that baseline during specific weather events, causing the most severe coastal flooding.
References
- 'God Only Knows': As Sea Level Rise Threatens Harvard and Cambridge, Officials Scramble For Solutions - The Harvard Crimson
- Study of sea-level rise finds land sinking along East Coast - Harvard Gazette
- Global and Regional Sea Level Rise Scenarios for the United States: Updated Mean Projections and Extreme Water Level Probabilities Along U.S. Coastlines (2022 Technical Report) - NOAA / multi-agency
- Sea Level Rise Viewer - NOAA Climate.gov
- Sea level rise and coastal flood risk maps - Climate Central
- Finding the fingerprints that explain sea-level rise - The Salata Institute at Harvard University
- Harvard Voices on Climate Change: Sea Level Rise - YouTube / The Salata Institute at Harvard University
Recommended
Last updated April 16, 2025